Visualization techniques are concerned with depicting data in a form such as images, diagrams, or animations
that make it easier for minds to process. Perceptual maps and
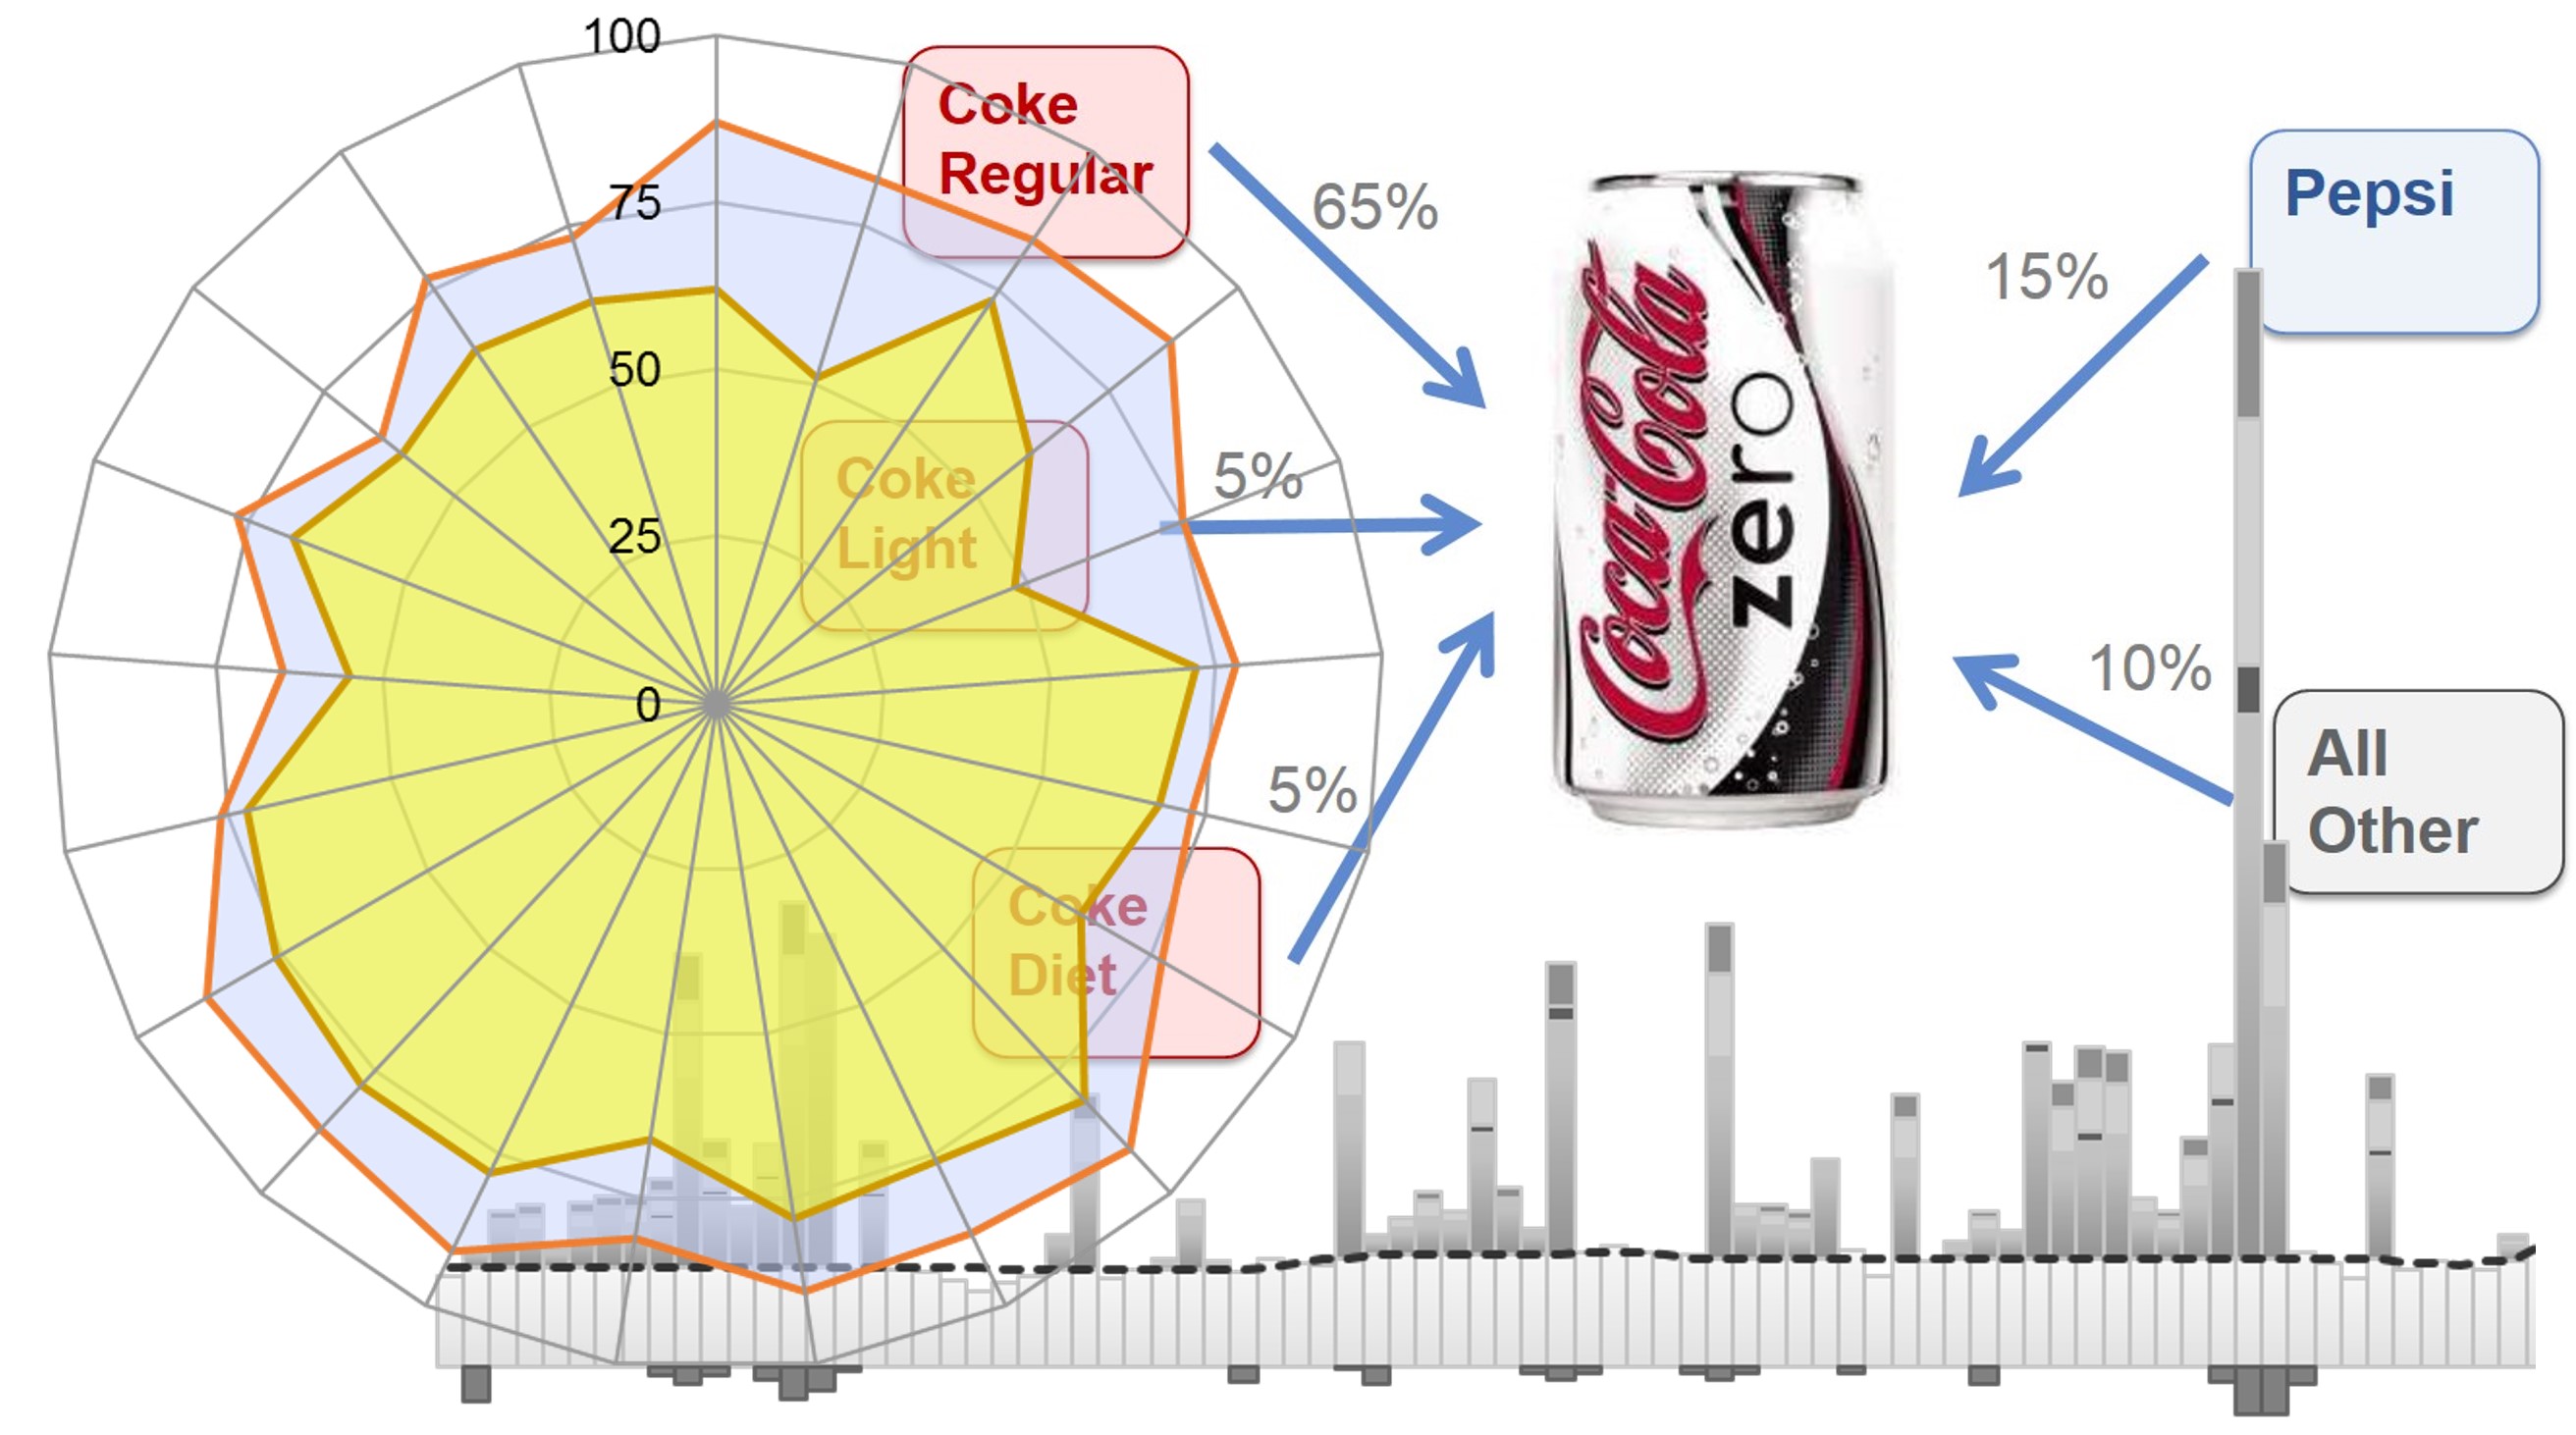
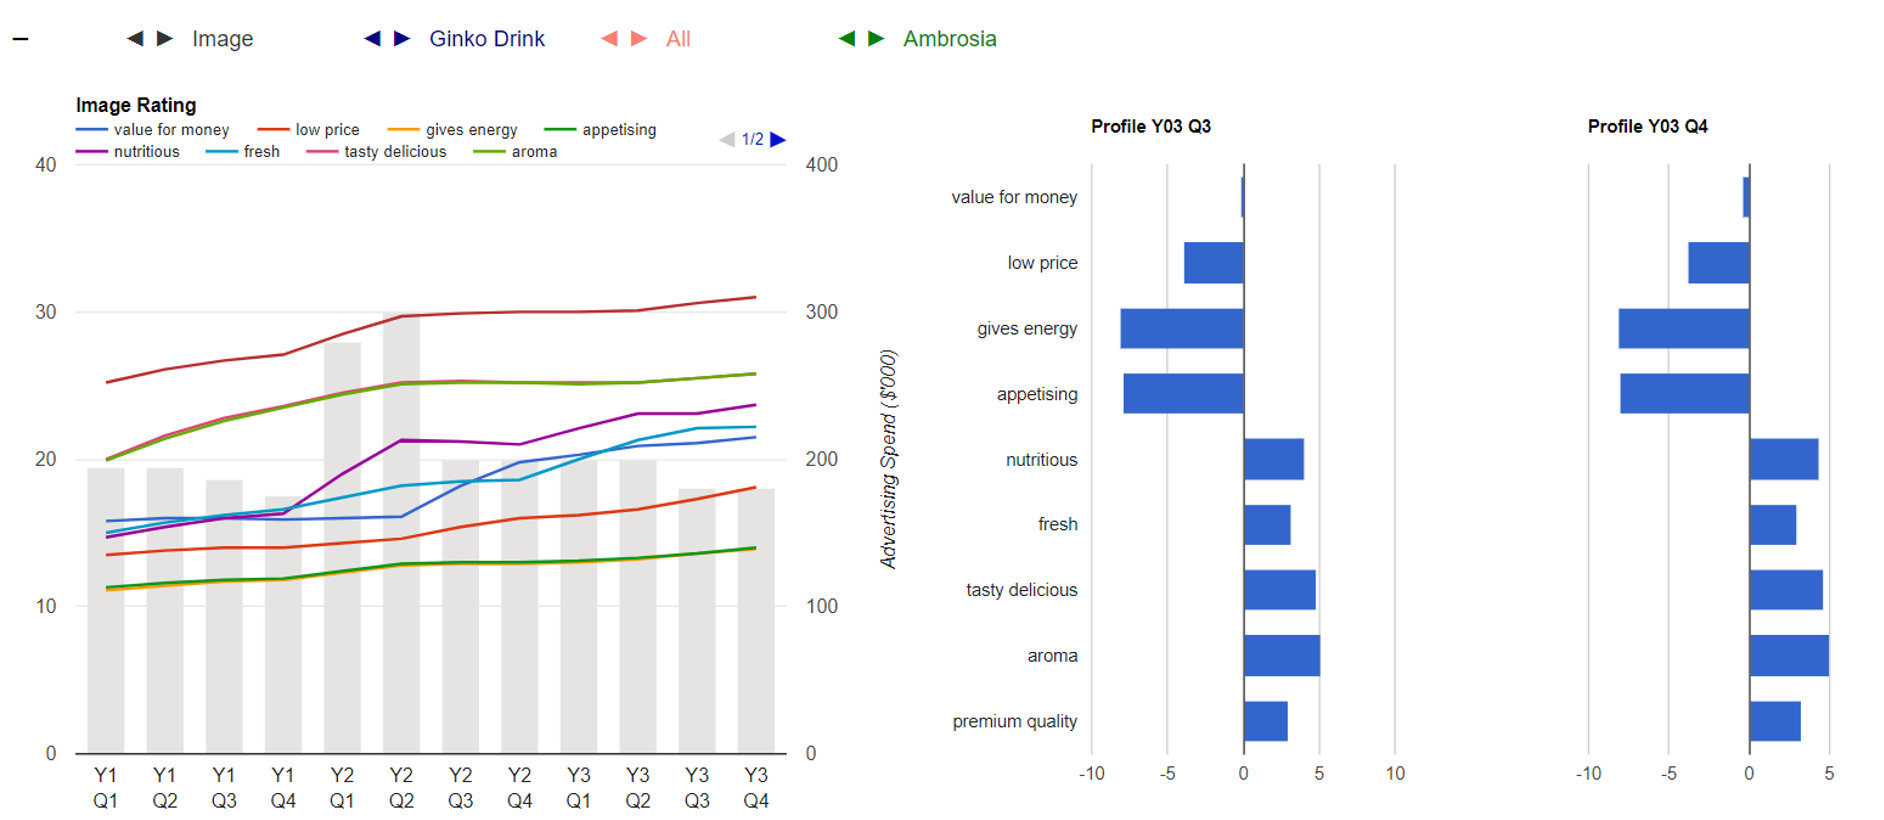
image profiling
are two examples of visualization of data from Chapter Brand Sensing. Since the advent of big
data, the pace of research and innovation in this field has grown
substantially. Tag or word clouds, clustergrams, history and spatial
information flow are some examples of the techniques used for visualizing big data.
Good visualization
serves to empower users with the information they need, in a
digestible, easy to access manner. Technology should be used to make contents relevant, simple, clear and
customized for the user. Context should be carried forward to substantially reduce the amount of
time and effort required by the user in searching for information.