
-
Brand Equity
Brand Equity
Zen versus i-Pod
Benefits
Loyalty Pyramid
NPI, NAI
Brand Equity Models
Brand Equity Index
Brand Equity Drivers
Analysis and Interpretation
Overview
- Brand Sensing
- Brand Equity
- Marketing Education
- How to Choose the Right Marketing Simulator
- Self-Learners: Experiential Learning to Adapt to the New Age of Marketing
- Negotiation Skills Training for Retailers, Marketers, Trade Marketers and Category Managers
- Simulators becoming essential Training Platforms
- What they SHOULD TEACH at Business Schools
- Experiential Learning through Marketing Simulators
-
MarketingMind
Brand Equity
Brand Equity
Zen versus i-Pod
Benefits
Loyalty Pyramid
NPI, NAI
Brand Equity Models
Brand Equity Index
Brand Equity Drivers
Analysis and Interpretation
Overview
- Brand Sensing
- Brand Equity
- Marketing Education
- How to Choose the Right Marketing Simulator
- Self-Learners: Experiential Learning to Adapt to the New Age of Marketing
- Negotiation Skills Training for Retailers, Marketers, Trade Marketers and Category Managers
- Simulators becoming essential Training Platforms
- What they SHOULD TEACH at Business Schools
- Experiential Learning through Marketing Simulators
Brand Equity — Analysis and Interpretation
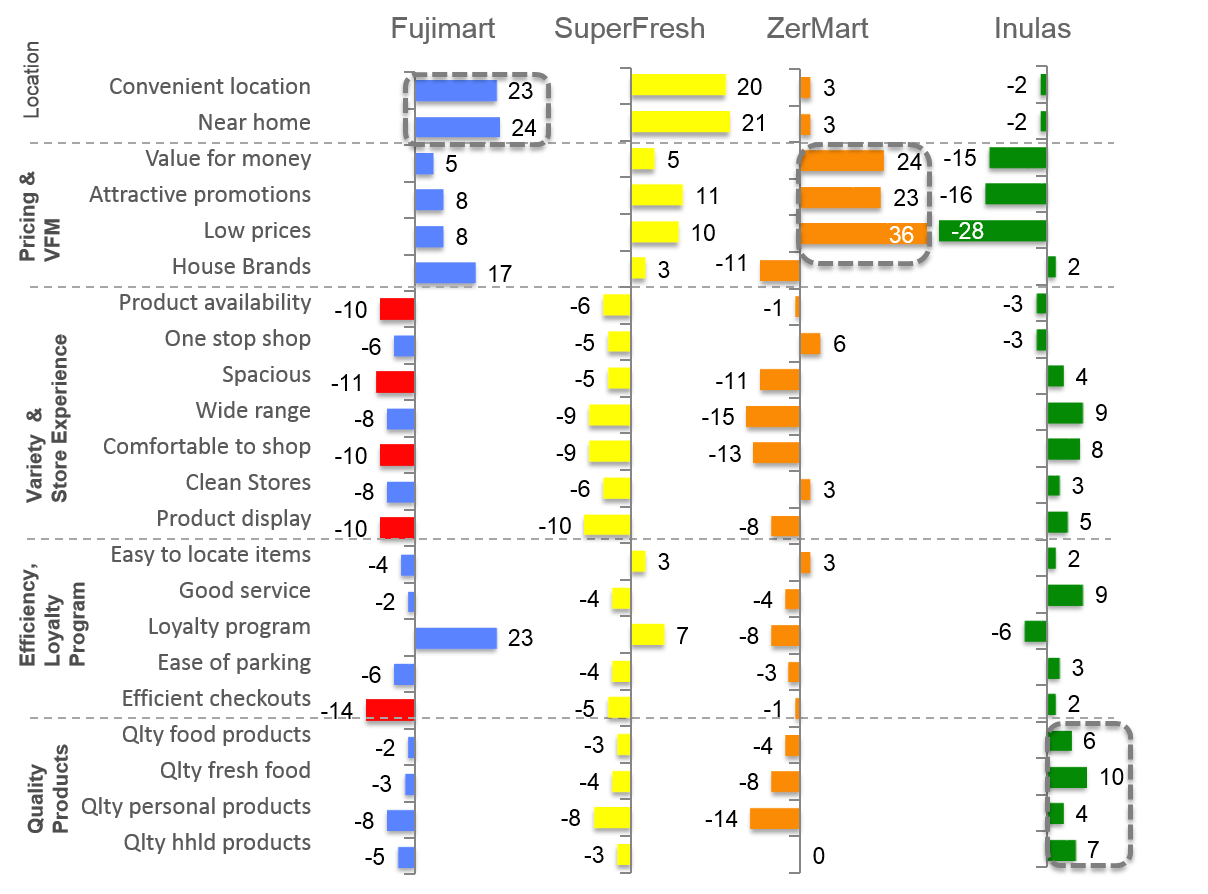
The image profile of supermarket banners in Exhibit 2.14 is constructed using the profiling techniques described in the article Brand Image Tracking. The attributes are grouped according to factors, with the important factors placed towards the top, and less important ones towards the bottom. This chart reveals the distinct positioning of each of the chains.
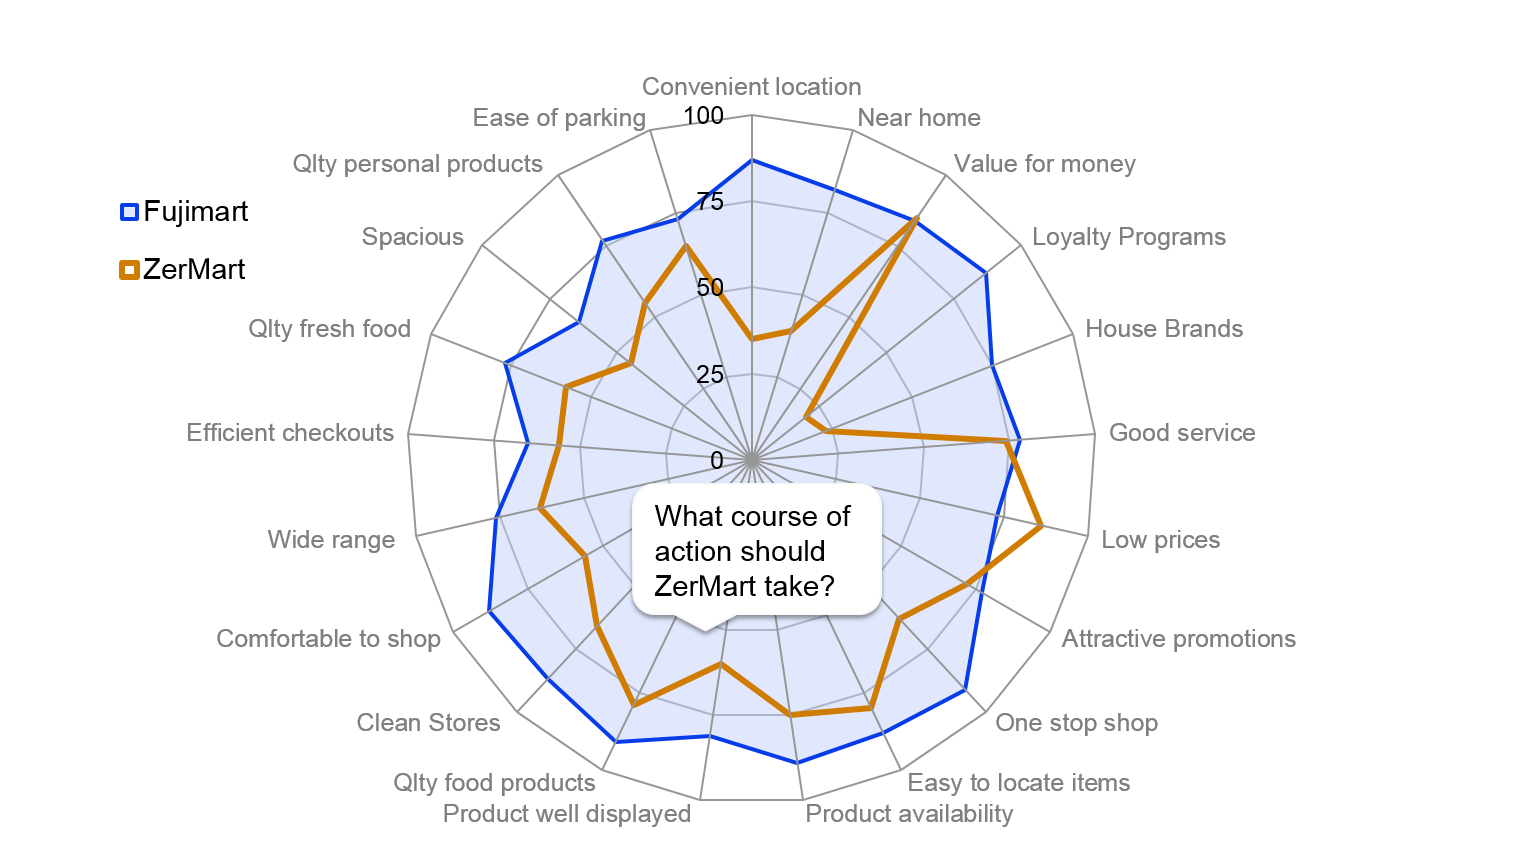
Exhibit 2.15 Image rating analysis of ZerMart and Fujimart.
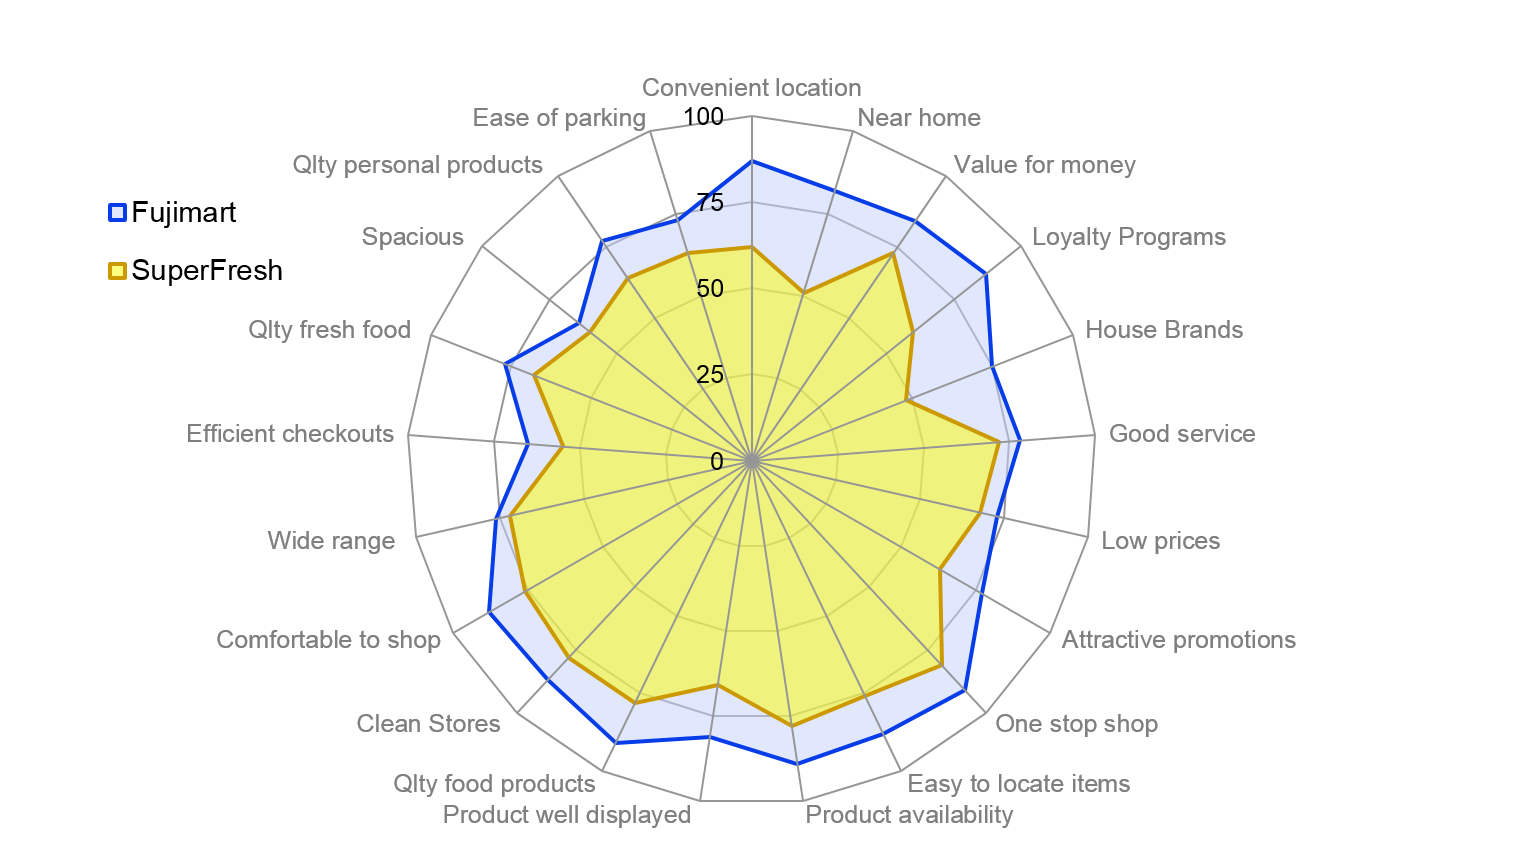
Exhibit 2.16 Image rating analysis of SuperFresh and Fujimart.
The spider charts in Exhibits 2.15-2.18 reveal the strengths and weaknesses of a brand’s image from the viewpoint of regular shoppers. The approach for constructing these charts is as follows:
- For each supermarket banner the data is filtered so that it includes only those shoppers who regularly shop at the chain.
- The chart pertains to the top 2 box rating (“strongly agree”, “agree”) for the chains on each of the attributes. The scale is from 0 at the centre of the web to 100% at the circumference.
- The attributes are arranged in order of importance in a clockwise manner, with the most important attribute at the top.
The analysis reveals how each brand is rated vis-à-vis its competitors. The key points emerging from analysis of the charts in Exhibits 2.14–2.16 are as follows:
- ZerMart differentiates on low prices, value for money and attractive promotions. Its “price fighter” strategy appears to be yielding strong gains — the banner’s equity index (Exhibit 2.10) surged from 1.1 to 1.4, dependables are up from 7% to 10% (Exhibit 2.3), and preferrers swelled from 8% to 12% (+50%). Though it is fast increasing, awareness remains low, and shoppers are constrained by the lack of convenient locations.
- SuperFresh is a me-too brand that is competing head-on with a visibly stronger Fujimart. Observe how Fujimart totally envelops it in Exhibit 2.16. This similarity is reflected also in Exhibit 2.14. The chain needs to effectively differentiate.
- The weaker aspects in the Fujimart’s image profile (highlighted in Exhibit 2.14) suggest that the chain is experiencing difficulties coping with increased store traffic. The negative skews on efficient check out, spacious, product display and availability, and comfortable shopping experience reflect the growth pains that the chain is probably facing. It seems Fujimart needs to accommodate an ever increasing number of shoppers, and should consider opening more stores, increasing store sizes or entering into larger store formats, hypermarkets for instance.
- Fujimart is stronger on attributes that are of greatest importance to shoppers; its strengths are well aligned to the needs and preferences of shoppers in general.
Example Inulas
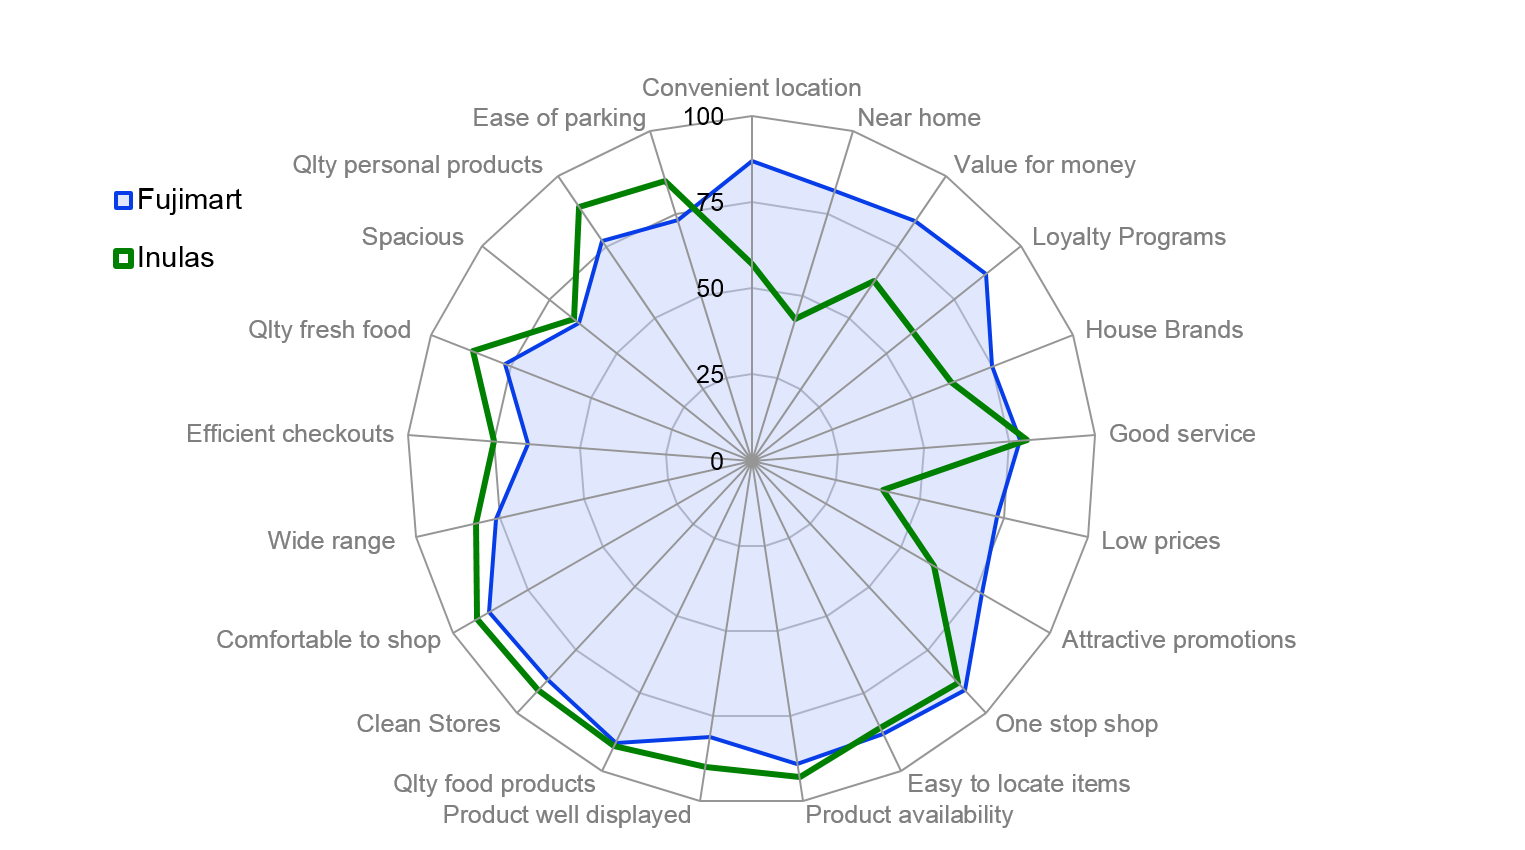
Exhibit 2.17 Image rating of Inulas and Fujimart, all homes.
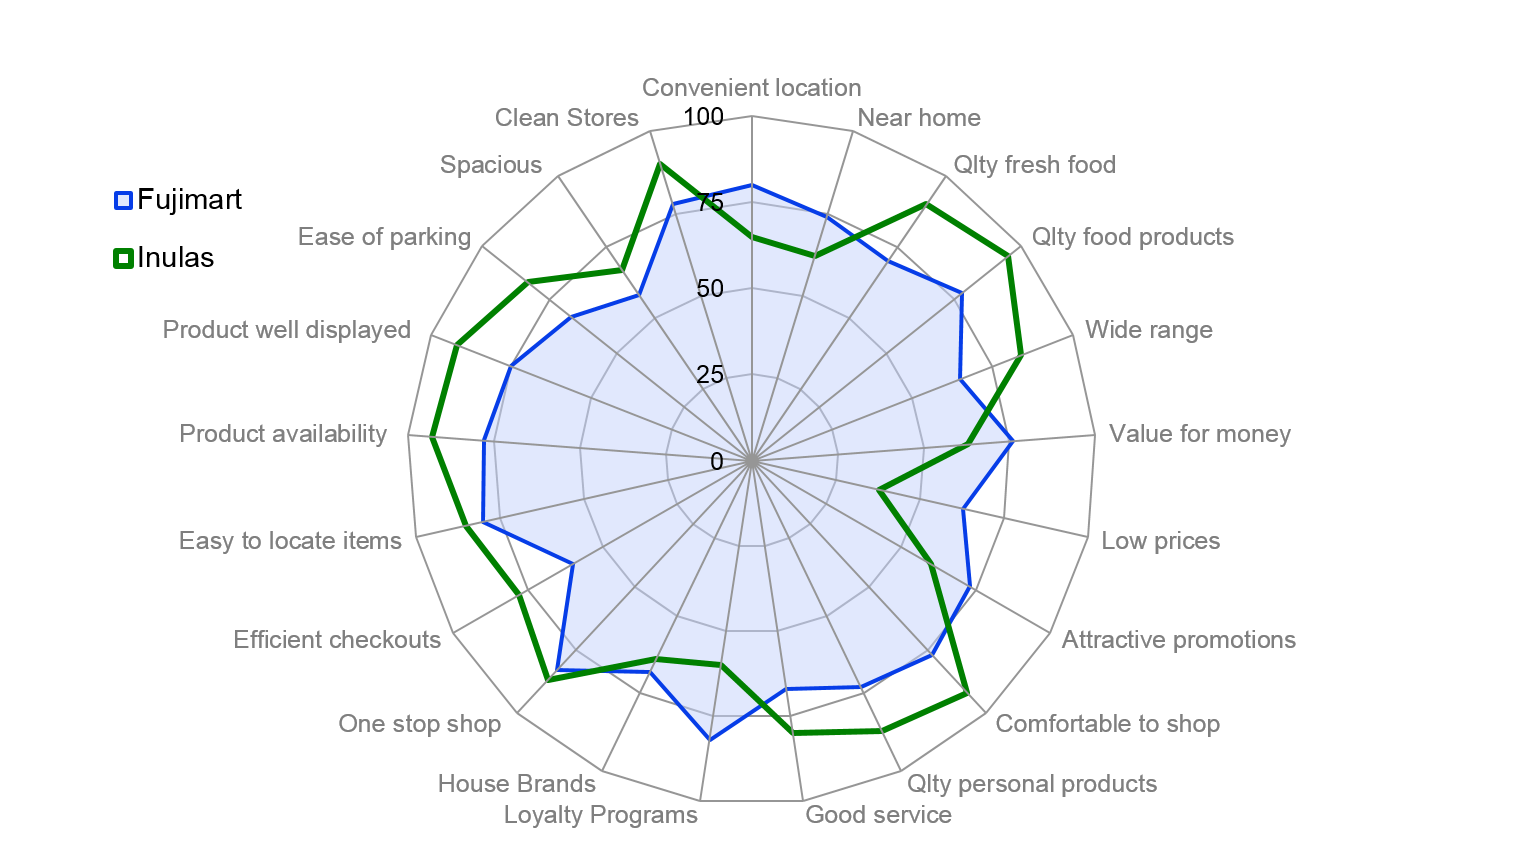
Exhibit 2.18 Image rating of Inulas and Fujimart, high-income homes.
The data that we have been referring to over the course of this chapter is apt for studying the application of store equity research. Exhibits 2.3-2.6 depict the loyalty pyramid, loyalty matrix and the loyalty segments for some supermarkets. Exhibit 2.10 depicts their store equity indices. The relevant brand image attributes and factors, factor importance, and attribute importance are covered in Exhibits 2.11-2.13; and the banner image ratings are covered in Exhibits 2.14-2.18. Collectively these exhibits provide thorough insights into customers’ shopping behaviour and their perceptions of the major banners.
Consider the supermarket chain Inulas. At first glance it would appear from Exhibit 2.17 that Inulas is not aligned with shoppers’ priorities. It is strong mainly on attributes of low importance, and it is weak on those attributes, namely price and location, that are of greatest importance to shoppers.
It is important to note, however, that whatever strategy Inulas adopts must be aligned to the needs and preferences of its target shoppers. It is apparent from Exhibit 2.10 that the banner is targeting upmarket shoppers (Inulas’ equity index is 4.3 for high-income homes, compared to 0.8 for low-income homes). To draw conclusions and recommendations, we should therefore refer to Exhibit 2.18, where the image rating analysis is drawn on the high-income segment. As can be seen from this exhibit, the banner’s positioning is better aligned with the factors that drive its target shoppers. Moreover, on this base of high-income shoppers, Inulas outperforms market leader Fujimart on a number of attributes.
Though “low price” and “value for money” are the prime weak spots, it may not be advisable for Inulas to shifts its focus to these areas as it is hard to alter perceptions 180° and lowering prices will erode the margins that the chain needs to support superior services. Moreover, by drawing attention to attributes where it is perceived as weak, the chain would inadvertently reinforce their importance in shoppers’ minds.
It is advisable instead that Inulas focusses on areas of strength, remaining well differentiated from Fujimart and the other banners. To expand its shopper base, it should evoke through advertising, greater desire amongst shoppers for better quality products, wider variety, and superior shopping experience. Drawing shoppers’ attention to these areas of strength would motivate them to shop at Inulas. Markets after all, are dynamic; the importance in driving brand equity, of those attributes where Inulas’ core strengths lie, can be reinforced through marketing.
Previous Next
Use the Search Bar to find content on MarketingMind.
Marketing Analytics Workshop
In an analytics-driven business environment, this analytics-centred consumer marketing workshop is tailored to the needs of consumer analysts, marketing researchers, brand managers, category managers and seasoned marketing and retailing professionals.
Digital Marketing Workshop

Unlock the Power of Digital Marketing: Join us for an immersive online experience designed to empower you with the skills and knowledge needed to excel in the dynamic world of digital marketing. In just three days, you will transform into a proficient digital marketer, equipped to craft and implement successful online strategies.


Contact | Privacy Statement | Disclaimer: Opinions and views expressed on www.ashokcharan.com are the author’s personal views, and do not represent the official views of the National University of Singapore (NUS) or the NUS Business School | © Copyright 2013-2024 www.ashokcharan.com. All Rights Reserved.