
-
Retail Tracking
Retail Tracking
The Nielsen Code
Applications of Retail Tracking
Where to Measure Sales?
Retail Measurement Services
Retail Universe
Retail Census
Sample Design — Retail Tracking
Data Collection — Retail Tracking
Data Processing — Retail Tracking
Data Projection — Retail Tracking
Analysis and Interpretation — Retail Tracking
Numeric and Weighted Distribution
In-Stock and Out-of-Stock Distribution
Coverage Analysis — Retail Tracking
Pipeline Effect
- Retail Tracking
- Sales and Distribution
- Retail Analytics
- Category Management
- Marketing Education
- How to Choose the Right Marketing Simulator
- Self-Learners: Experiential Learning to Adapt to the New Age of Marketing
- Negotiation Skills Training for Retailers, Marketers, Trade Marketers and Category Managers
- Simulators becoming essential Training Platforms
- What they SHOULD TEACH at Business Schools
- Experiential Learning through Marketing Simulators
-
MarketingMind
Retail Tracking
Retail Tracking
The Nielsen Code
Applications of Retail Tracking
Where to Measure Sales?
Retail Measurement Services
Retail Universe
Retail Census
Sample Design — Retail Tracking
Data Collection — Retail Tracking
Data Processing — Retail Tracking
Data Projection — Retail Tracking
Analysis and Interpretation — Retail Tracking
Numeric and Weighted Distribution
In-Stock and Out-of-Stock Distribution
Coverage Analysis — Retail Tracking
Pipeline Effect
- Retail Tracking
- Sales and Distribution
- Retail Analytics
- Category Management
- Marketing Education
- How to Choose the Right Marketing Simulator
- Self-Learners: Experiential Learning to Adapt to the New Age of Marketing
- Negotiation Skills Training for Retailers, Marketers, Trade Marketers and Category Managers
- Simulators becoming essential Training Platforms
- What they SHOULD TEACH at Business Schools
- Experiential Learning through Marketing Simulators
Retail Census
Once the universe is defined, an establishment survey called a retail census is conducted to measure the size and characteristics of the universe. These estimates, which are updated on a regular basis, are used to:
- Identify different outlet types and quantify number of outlets in a universe by type.
- Provide key statistics for setting up a representative retail panel.
Details collected in a retail census typically include outlet name, address, telephone number, outlet type, use of scanning equipment, presence of air-conditioning, refrigeration facilities, number of hours open per day, monthly turnover, floor space, and presence of major product categories.
For the organized trade, most of these details are readily available from secondary sources including retailer websites.
For the traditional trade, field personnel armed with area maps and questionnaires, go street by street collecting the relevant information. Most of the information is gathered by observation, and the remainder may be obtained from store owners or their employees.
Some store owners may choose not to disclose information such as their sales turnover. In these instances, statisticians project the missing data based on various store characteristics, including store type, location, floor size, number of major categories stocked, facilities, and other relevant factors.
Establishment Survey
Undertaking a complete census that covers an entire country for the purpose of retail measurement is often impractical and not cost-effective. Instead, a retail census is conducted in the form of an establishment survey, which aims to estimate the size and characteristics of the retail universe. To ensure the data has minimal statistical error, the establishment survey is conducted using a large sample that covers the defined universe. This approach allows for accurate insights into the retail landscape while maintaining a balance between practicality and statistical accuracy.
For sampling purposes, the defined universe is split into several mapped areas called primary sampling units (PSU). The PSUs are categorized by some measure of size into groups such as cities, towns, villages or polling districts. For the establishment survey, statisticians carefully select a representative sample of PSUs. Subsequently, every outlet within the chosen sample is surveyed to gather data, and the results are then projected to the entire universe.
Rolling Census
A common approach called the rolling census is used for relatively small yet significant geographical areas such as cities. It involves dividing the primary sampling units (PSUs) into multiple replicas, ensuring that each replica exhibits similar characteristics in terms of geographical spread, store types, and location types. The survey then rotates periodically, typically every six months, from one replica to another until all replicas are covered over time.
For example, in Singapore, the retail audit PSUs were initially based on the polling districts designated for the 1994 general elections. These 640 PSUs were divided into four replicas, each resembling the others in terms of housing estates, regions, retail channels and other important characteristics. The establishment survey is conducted over a six-month period, with the rotation rolling from one replica to another. Within a span of two years, all four replicas are covered, and the cycle continues.
While projecting each replica to the universe provides a reasonably good estimate due to their similarities and representativeness, some biases may still arise. To address this, more accurate projection techniques that account for these biases can be adopted, ensuring greater precision in the estimation process.
The primary objective of the retail census is to provide a foundation for the sample design, which in turn supports the retail tracking service. It does however serve a number of secondary objectives. For instance, its use by sales management to develop sales plans. Additionally, the aggregate data obtained from the census offers valuable insights into retail trends in various countries and regions worldwide.
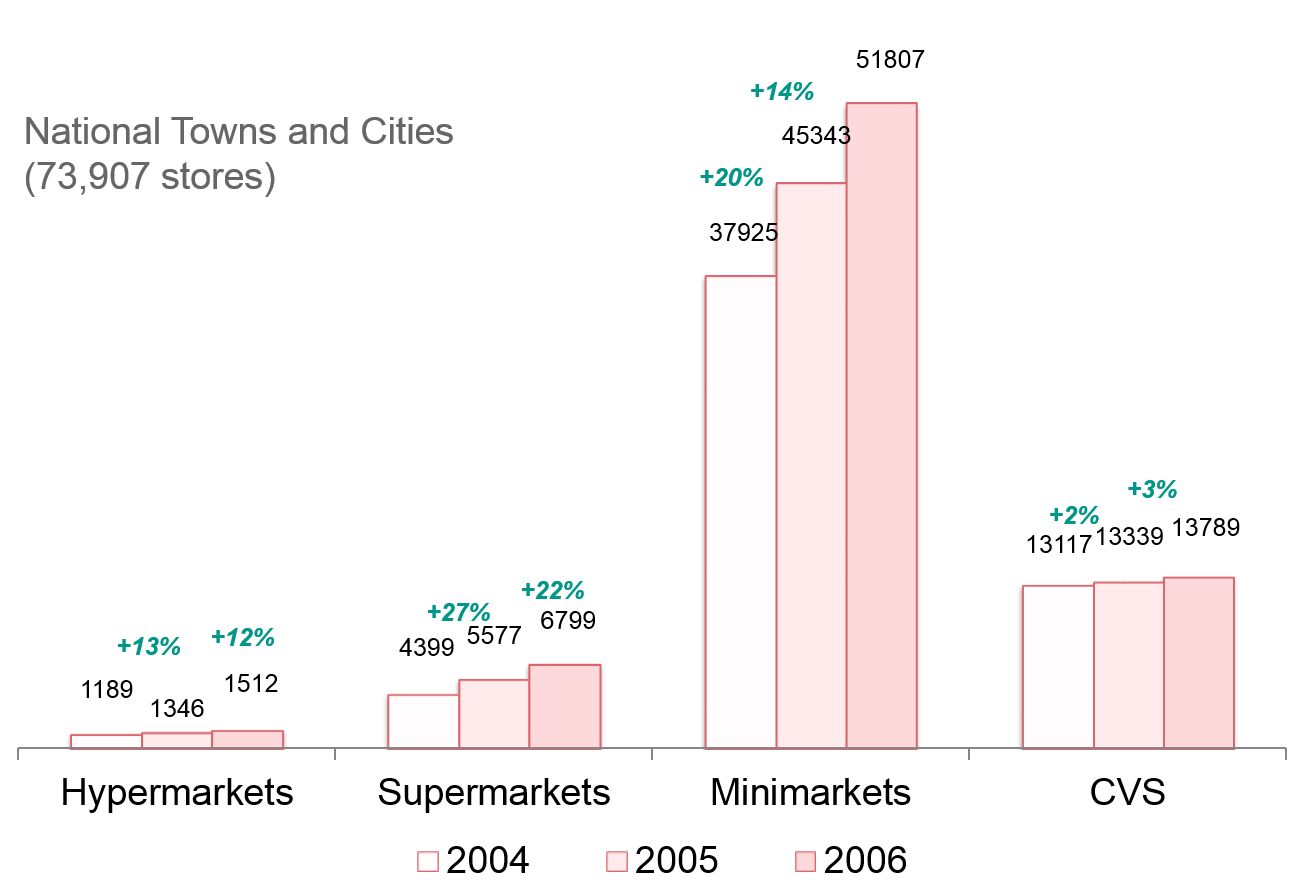
For example, Exhibit 29.8 showcases the remarkable growth of modern trade in China during 2004-2006, highlighting the country’s changing retail landscape.
By leveraging the information collected through the retail census, sales management can make informed decisions, and stakeholders gain a broader understanding of retail trends and dynamics at both local and global levels.
Previous Next
Use the Search Bar to find content on MarketingMind.
Marketing Analytics Workshop
In an analytics-driven business environment, this analytics-centred consumer marketing workshop is tailored to the needs of consumer analysts, marketing researchers, brand managers, category managers and seasoned marketing and retailing professionals.
Digital Marketing Workshop
Unlock the Power of Digital Marketing: Join us for an immersive online experience designed to empower you with the skills and knowledge needed to excel in the dynamic world of digital marketing. In just three days, you will transform into a proficient digital marketer, equipped to craft and implement successful online strategies.
Business Intelligence - Market and Trade
Suite of interactive, online dashboards that seamlessly integrate retail and consumer data sources in a manner that makes it easier to glean insights.
Scan Track
Suite of dashboards to visualize/analyse retail scan data.
Online Apps to train Category Managers
The Plannogrammer is an experiential learning facility for category managers, trade marketers, and retailers in consumer markets. Ideally suited for hybrid learning programmes, Plannogrammer imparts hands-on training in the planning and evaluation of promotions and merchandising.
It supports a collection of simulation and analysis platforms such as Promotions and Space Planner for optimizing space and promotions, Plannogram for populating shelves and merchandising, a Due To Analysis dashboard that decomposes brand sales into the factors driving sales, and a Promotion Evaluator to evaluate the volume, value and profit impact of promotion plans.


Contact | Privacy Statement | Disclaimer: Opinions and views expressed on www.ashokcharan.com are the author’s personal views, and do not represent the official views of the National University of Singapore (NUS) or the NUS Business School | © Copyright 2013-2024 www.ashokcharan.com. All Rights Reserved.