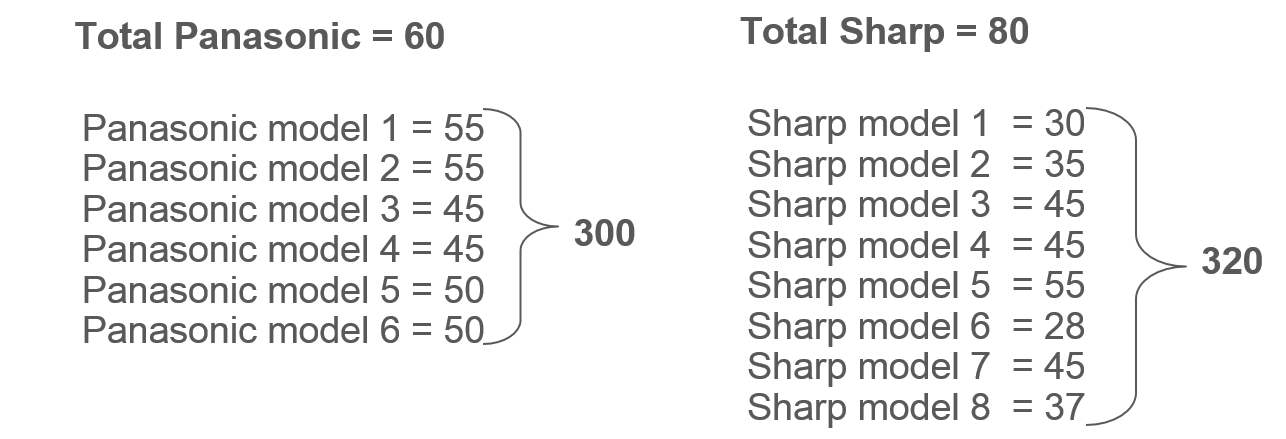
Exhibit 30.4 Numeric distribution of Panasonic and Sharp flat
screen TVs.
Let us consider the availability of flat screen TVs in
stores carrying consumer durables. In this hypothetical example, there are two brands — Panasonic
and Sharp, and numeric distribution indicates that flat screen TVs are available in 90% of the
stores.
Based on the distribution of these brands and their individual models, as
given in Exhibit 30.4, we can compute the following
relevant information:
- Average number of flat screen TVs stocked per store:
(300 + 320)/90 = 6.9
- Average number of Sharp TVs stocked where Sharp is listed:
320/80 = 4
- Average number of Panasonic TVs stocked where Panasonic is listed:
300/60 = 5
- Share of items:
Panasonic’s share of items: 300/620 = 48.4%
Sharp’s share of items: 320/620 = 51.6%
- Efficiency rate for the two brands:
Sharp’s efficiency rate: 4/8 = 50%
Panasonic’s efficiency rate: 5/6= 80.3%
One conclusion that can be drawn from this
example, is that Sharp has greater width of distribution
whereas Panasonic has greater depth. It appears that Sharp has greater
success in getting listed, whereas Panasonic is better at securing depth where
listed.