
-
Sales & Distribution
Sales and Distribution
Interdependence of Demand and Supply
Components of Sales — Width & Depth
Measures of Distribution (Width)
Sales and Distribution Priorities
Distribution Network — Basics
Relationship between Sales and Distribution
Right Channels, Right Chains
Right Assortment
Managing Assortment
Battle of Shelf Space
Measures of Assortment and Sales Velocity
Number of Items Stocked
Assortment Analysis
Sales per Point of Weighted Distribution
Share in Handlers
Average Sales per Store
Rate of Sales
Rate of Sales/Gross Profit
Portfolio Analysis
Fragmentation Analysis
Securing Retailer Support
Managing Stock in Trade
Allocation of Shelf Space
Cost of Stockouts
- Retail Tracking
- Sales and Distribution
- Retail Analytics
- Category Management
- Marketing Education
- How to Choose the Right Marketing Simulator
- Self-Learners: Experiential Learning to Adapt to the New Age of Marketing
- Negotiation Skills Training for Retailers, Marketers, Trade Marketers and Category Managers
- Simulators becoming essential Training Platforms
- What they SHOULD TEACH at Business Schools
- Experiential Learning through Marketing Simulators
-
MarketingMind
Sales & Distribution
Sales and Distribution
Interdependence of Demand and Supply
Components of Sales — Width & Depth
Measures of Distribution (Width)
Sales and Distribution Priorities
Distribution Network — Basics
Relationship between Sales and Distribution
Right Channels, Right Chains
Right Assortment
Managing Assortment
Battle of Shelf Space
Measures of Assortment and Sales Velocity
Number of Items Stocked
Assortment Analysis
Sales per Point of Weighted Distribution
Share in Handlers
Average Sales per Store
Rate of Sales
Rate of Sales/Gross Profit
Portfolio Analysis
Fragmentation Analysis
Securing Retailer Support
Managing Stock in Trade
Allocation of Shelf Space
Cost of Stockouts
- Retail Tracking
- Sales and Distribution
- Retail Analytics
- Category Management
- Marketing Education
- How to Choose the Right Marketing Simulator
- Self-Learners: Experiential Learning to Adapt to the New Age of Marketing
- Negotiation Skills Training for Retailers, Marketers, Trade Marketers and Category Managers
- Simulators becoming essential Training Platforms
- What they SHOULD TEACH at Business Schools
- Experiential Learning through Marketing Simulators
Allocation of Shelf Space (Forward Stock)

Exhibit 30.13 Share of space vs share of market.
| Forward Stock % | Sales% | Ratio | |
| Item 1 | 5.0 | 7.5 | 67 |
| Item 2 | 5.0 | 7.5 | 100 |
| Item 3 | 5.0 | 7.5 | 143 |
Exhibit 30.14 Stock to sales ratio.
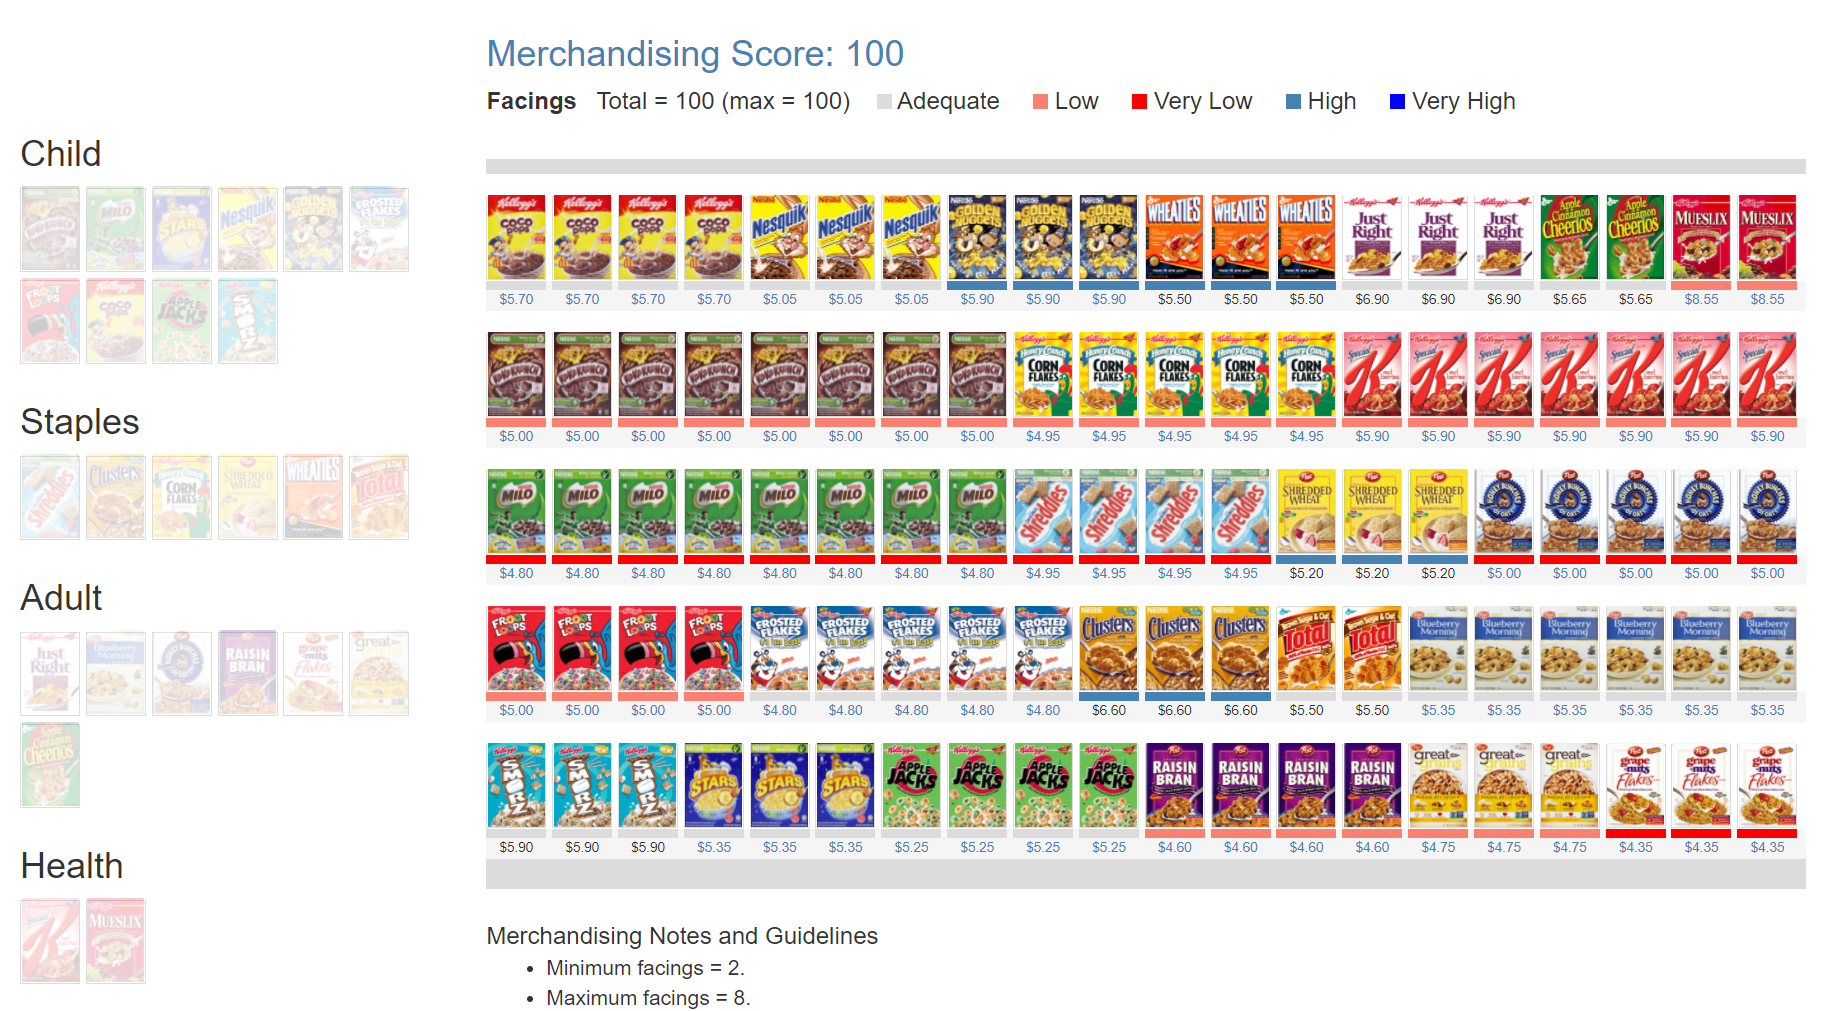
Retailers place great importance to the allocation of shelf space, as poor allocation can lead to stockouts and excessive inventory. This results in lost sales and increased holding costs. To optimize forward stock, shelf space is typically allocated in proportion to demand, where the share of space roughly corresponds to the share of sales. However, merchandising considerations also play a role in the allocation process.
Stock to Sales Ratio
Retailers strive to maintain a wider range of products and accommodate both big and small brands. As a result, big brands may receive slightly less space than their sales share, while strategically important brands may be allocated more space.
Additionally, retailers have merchandising norms that impact space allocation, such as maintaining a minimum of two facings for most items. This benefits small brands that may not have high sales but still deserve visibility.
The relationship between stock and sales follows a pattern illustrated in Exhibit 30.13, where the share of space is lower than the share of the market for big brands, and the share of space is higher than the share of the market for small brands to meet the minimum facing requirements set by the retailer.
The stock to sales ratio, calculated by dividing the stock share by the sales share, is used to review stock allocation. For example, in Exhibit 30.14, Item 1 is receiving less space than its fair share, while Item 3 is allocated more space than it deserves.
Stock Turns
Shelf space is the most valuable physical asset that retailers own, and its effective utilization directly impacts their profitability. The retail business model is therefore centred on the notion of stock turns and return on inventory. “Stock turns” is the number of times per year that the shelf inventory is replenished. It can be calculated as follows: $$ Stock \,turns = \frac{Annual\,Sales\,(Units)}{Average\,Inventory\,on\,Shelf\,(Units)}$$
For instance, if an item has a full-year sales of 1,200 units and an average stock on the shelf of 24 units, its stock turns would be 50. This means that the forward stock in is replenished 50 times per year, or approximately once a week.
By focusing on optimizing stock turns, retailers can maximize their use of valuable shelf space and improve their overall profitability.
Previous Next
Use the Search Bar to find content on MarketingMind.
Marketing Analytics Workshop
In an analytics-driven business environment, this analytics-centred consumer marketing workshop is tailored to the needs of consumer analysts, marketing researchers, brand managers, category managers and seasoned marketing and retailing professionals.
Digital Marketing Workshop

Unlock the Power of Digital Marketing: Join us for an immersive online experience designed to empower you with the skills and knowledge needed to excel in the dynamic world of digital marketing. In just three days, you will transform into a proficient digital marketer, equipped to craft and implement successful online strategies.
Online Apps to train Category Managers
The Plannogrammer is an experiential learning facility for category managers, trade marketers, and retailers in consumer markets. Ideally suited for hybrid learning programmes, Plannogrammer imparts hands-on training in the planning and evaluation of promotions and merchandising.
It supports a collection of simulation and analysis platforms such as Promotions and Space Planner for optimizing space and promotions, Plannogram for populating shelves and merchandising, a Due To Analysis dashboard that decomposes brand sales into the factors driving sales, and a Promotion Evaluator to evaluate the volume, value and profit impact of promotion plans.


Contact | Privacy Statement | Disclaimer: Opinions and views expressed on www.ashokcharan.com are the author’s personal views, and do not represent the official views of the National University of Singapore (NUS) or the NUS Business School | © Copyright 2013-2024 www.ashokcharan.com. All Rights Reserved.