
-
Marketing mix Modelling
Marketing mix Modelling
Sales Response Function
Linear
Concave
Convex
S-Curve
Interaction Effects
Competitive Effects and Market Share Models
Market Share Models
Dynamic Effects
Adstock
Adfactor
Leads and Lags
Parameter Functions
Long Term Effect (Advertising)
Baseline and Incremental Volume
Promotions Response Model
Model Validity — How Good is the Fit?
Watchouts and Guidelines
Interpretation and Analysis
Discount Elasticity
Cannibalization
Sales Decomposition and Due-To Analysis
What-If Analysis
- Basic Statistics
- Sampling
- Marketing mix Modelling
- Marketing Education
- Is Marketing Education Fluffy and Weak?
- How to Choose the Right Marketing Simulator
- Self-Learners: Experiential Learning to Adapt to the New Age of Marketing
- Negotiation Skills Training for Retailers, Marketers, Trade Marketers and Category Managers
- Simulators becoming essential Training Platforms
- What they SHOULD TEACH at Business Schools
- Experiential Learning through Marketing Simulators
-
MarketingMind
Marketing mix Modelling
Marketing mix Modelling
Sales Response Function
Linear
Concave
Convex
S-Curve
Interaction Effects
Competitive Effects and Market Share Models
Market Share Models
Dynamic Effects
Adstock
Adfactor
Leads and Lags
Parameter Functions
Long Term Effect (Advertising)
Baseline and Incremental Volume
Promotions Response Model
Model Validity — How Good is the Fit?
Watchouts and Guidelines
Interpretation and Analysis
Discount Elasticity
Cannibalization
Sales Decomposition and Due-To Analysis
What-If Analysis
- Basic Statistics
- Sampling
- Marketing mix Modelling
- Marketing Education
- Is Marketing Education Fluffy and Weak?
- How to Choose the Right Marketing Simulator
- Self-Learners: Experiential Learning to Adapt to the New Age of Marketing
- Negotiation Skills Training for Retailers, Marketers, Trade Marketers and Category Managers
- Simulators becoming essential Training Platforms
- What they SHOULD TEACH at Business Schools
- Experiential Learning through Marketing Simulators
Marketing mix Modelling — Sales Response Function
Marketing mix models embody “sales response functions” to relate the effects of marketing activities on sales. These functions are derived from historical market data using econometric and time series analysis techniques. They illustrate how sales are influenced by the various elements of the marketing mix.
The sales response functions are defined by their functional form, which describes the relationship between the dependent variable (sales) and the independent variables (e.g., price, advertising, promotion, etc.). This form determines the shape of the sales response curve and represents the characteristics of the marketing activity.
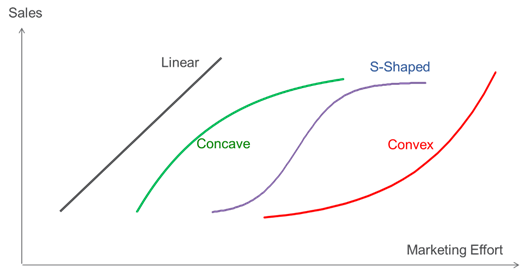
In essence, there are four fundamental shapes of sales response functions: linear, concave, convex, and S-shape, as depicted in Exhibit 36.2. Each shape signifies a different pattern of response between the marketing mix elements and sales. Understanding these shapes helps marketers comprehend how changes in marketing variables can impact sales performance.
Constant Returns to Scale (Linear) Model
The simplest functional form is the linear model which represents constant returns to scale:
$$ S=α+βX $$Where:
- S is sales, the dependent variable, and
- X is the independent variable representing the marketing effort for the marketing mix element.
- α and β are model parameters. α is the intercept — the sales when there is no marketing effort. β is coefficient for X. A unit change in X results in a change of β units in sales.
The linear model is theoretically unsound because it suggests that sales increase indefinitely. However, from a practical viewpoint, within a relatively small operating range, a linear model can provide a satisfactory approximation of the true relationship.
Diminishing Returns to Scale (Concave) Model
One of the most used forms in marketing mix modelling is the concave shape, which is characterized by diminishing returns to scale as the marketing activity increases. This aligns well with the expectation that as the intensity of discounts, displays and advertising increases, the returns diminish.
The semilog (semi logarithmic) model is an example of diminishing returns to scale function:
$$ S=α+βln(X) $$Another functional form that meets the diminishing return to scale requirement is the power model:
$$ S=e^α X^β, X>0\,and\,0<β<1.$$The power model is also known as the constant elasticity model due to its property that the power coefficient is the elasticity of demand of the marketing mix variable X:
$$\epsilon=\frac{\delta S}{\delta X}×\frac{X}{S}=βe^α X^{β-1}×\frac{X}{e^α X^β}=β$$The most widely used marketing mix model is a variation of the power model, called the multiplicative model:
$$ S=e^α X_1^{β_1} X_2^{β_2} X_3^{β_3} ... X_j^{β_j}, $$Where X1 to XJ are variables representing the marketing effort for various marketing mix elements, and X1 to XJ > 0.
This nonlinear structural model can be transformed into an estimation model that is linear in parameters by taking logarithms on both sides. The advantage of this transformation, which is shown below, is that the parameters of the original nonlinear model can be estimated using linear-regression techniques.
$$ ln(S)=α+β_1ln(X_1)+β_2ln(X_2)+β_3ln(X_3) ... +β_jln(X_j) $$The multiplicative form is widely used in marketing mix models such as Nielsen’s Scan*Pro, to evaluate promotions.
Increasing Returns to Scale (Convex) Model
The exponential model (S=eαeβX) is an example of a convex shaped, increasing returns to scale model. This may apply for price, provided it is represented as 1/P:
$$ S = S_0 e^{-βP}, β>0 $$The model assumes that the sales response to decreases in price may exhibit increasing returns to scale.
S-shaped Response Model
The S-shaped response function exhibits increasing returns to scale at low levels and diminishing returns at high levels of marketing effort. This is particularly plausible for advertising, where low levels get drowned by the noise, while very high levels may reach a saturation point.
The S-shape response function is also used for modelling the effect of shelf space on sales in store. The S-shape captures the notions of threshold and saturation. Below the threshold, marketing effort has no impact on sales, and above saturation, there is no further increase in sales. Within these threshold and saturation bounds, consumers become less responsive to the marketing stimuli.
The S-shaped response model has implications for how advertising should be planned and executed. If the response truly reflects the relationship between advertising and sales, it suggests different strategies for flighting advertising campaigns. An advertising burst involves a concentrated and heavy dose of advertising over a short period, designed to surpass the threshold levels. On the other hand, drip or continuous advertising involves lighter and consistent advertising spread over a longer duration. If a threshold exists, marketers should consider using less drip advertising unless it exceeds the threshold, and instead focus more on burst or pulse advertising — a strategy that alternates between periods of advertising and non-advertising over weeks or months.
While conceptually appealing, there is not much empirical evidence to support the existence of an S-shape response to advertising effort. It is hard to prove or disprove considering that historical data tends to lie well within these theoretical upper and lower bounds.
The logistic model takes a functional form that conforms to the S-shape:
$$ln \left( \frac{S-S_0}{S^0-S}\right)=α+βln(X), \,where \,0 \le S_0 \le S^0 $$Where, S0 is the intercept and the threshold level, and S0 is the saturation level.
The elasticity of demand, for a variable with an S-shaped response with sales, follows an inverted bell-shape, starting at 0 at threshold level to a maximum, and back to 0 at the saturation level.
A related but rare phenomenon is the notion of supersaturation. It refers to the excessive use of a marketing instrument, such as advertising, that theoretically may repulse consumers, creating a negative response to sales. It is rarely witnessed because marketers’ budgets are usually constrained; they operate below saturation levels and well below supersaturation levels. The supersaturation effect can be represented by the quadratic model:
$$S=α+β_1X-β_2X^2$$Previous Next
Use the Search Bar to find content on MarketingMind.


Contact | Privacy Statement | Disclaimer: Opinions and views expressed on www.ashokcharan.com are the author’s personal views, and do not represent the official views of the National University of Singapore (NUS) or the NUS Business School | © Copyright 2013-2026 www.ashokcharan.com. All Rights Reserved.