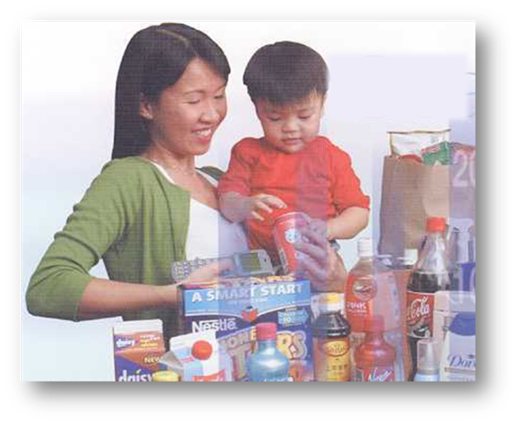
Exhibit 7.1 Panellist with handheld scanner. (Photo courtesy of NielsenIQ).
Since their inception in 1932,
developments in the use and application of consumer panels have greatly
contributed to the science of consumer analytics.
More recently, the explosion of data has
expanded the role and application of consumer analytics, such that it
cuts across virtually every sector of economic and social activity.
This chapter imparts an understanding of
consumer analytics through consumer panels. It covers the analytic tools
used to extract insights from consumer transactions.
The book takes an easy-to-understand approach
to explain a repertoire of metrics and techniques such as width and depth
of purchase, buyer groups, profile analysis, behavioural brand loyalty,
trial and repeat purchase, overlap analysis, basket analysis and gain–loss.
It focusses on the applications of these techniques to diagnose brand
health and address business issues.
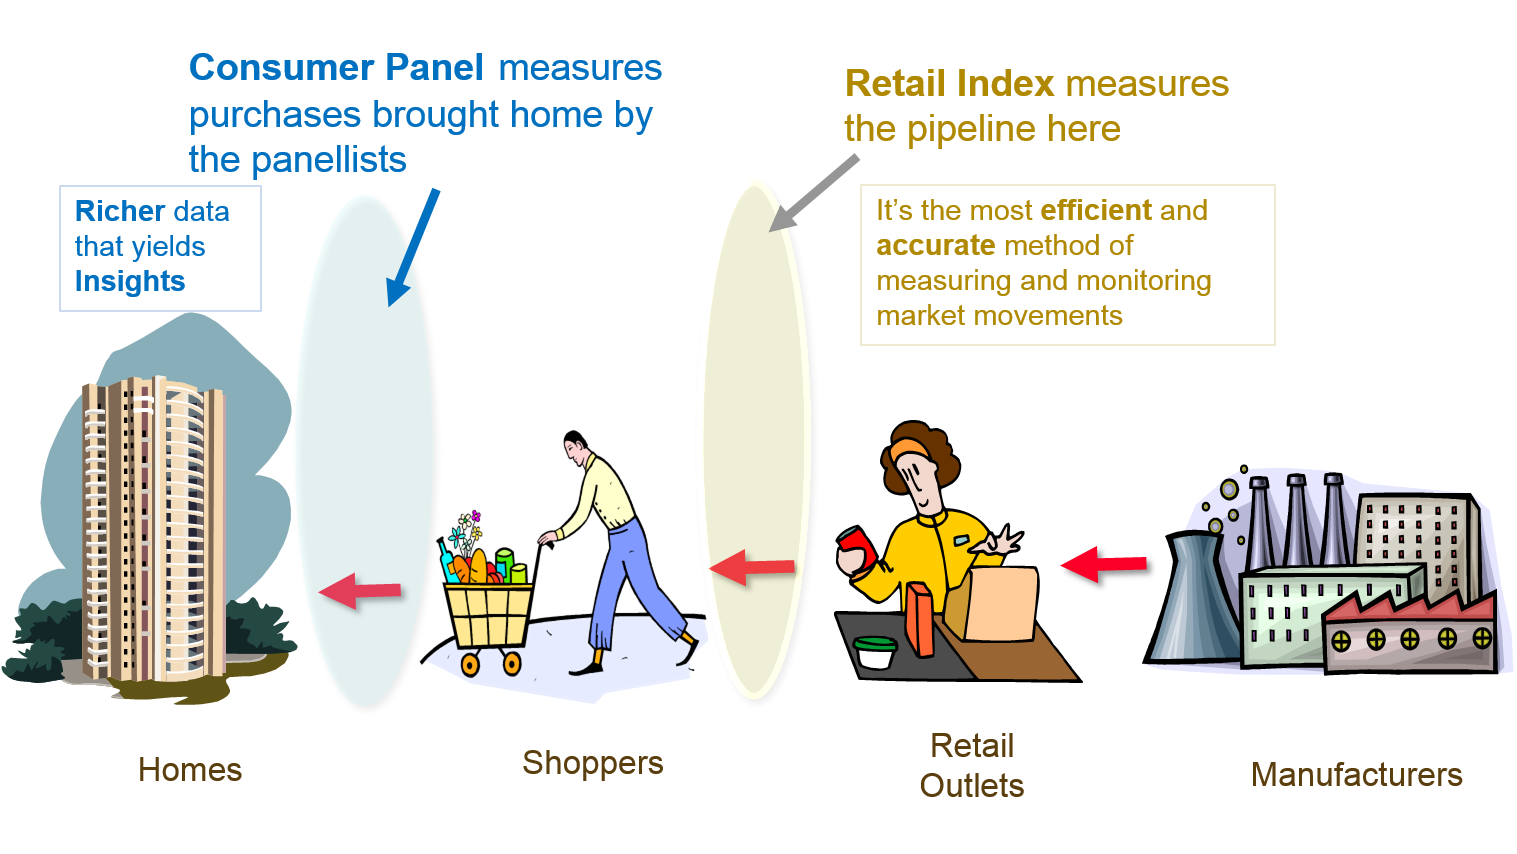
Exhibit 7.2 Different approaches to tracking sales as goods flow
along the path from manufacturer to retailer and shopper.
A Consumer Panel is a panel
of households or individuals whose purchases are monitored on a continuous
or ongoing basis. In some ways it is similar to a loyalty panel, which
comprises loyalty card holders. They both are powerful research platforms that
produce streams of continuous customer transaction data, which are ideal for
diagnosing the buying behaviour of products and services, where repeat
purchasing is the norm.
Though the scope does vary, the research methods
described in this chapter apply across the different forms of disaggregate
consumers’ purchasing data. Unlike consumer panels though, loyalty panels and
customer transaction data present only a blinkered view, confined to customers’
transactions within the organization. However, because they represent a larger
customer base, their data is more tactical/actionable in nature — it allows for
the execution of tactics, targeting segments or even individuals, at specific
locations, e.g., store, bank, etc.
Consumer panel data is broader in scope as it is not
confined to an organization’s customers. Yet because it is a platform that is
specifically created and maintained for research purposes, the data acquisition
cost for consumer panels is far greater than that for live sources like
customer transaction and loyalty data.
Exhibit 7.2 depicts the
different approaches to tracking sales as goods flow along the path from
manufacturer to retailer and from retailer to shopper. The data sourced at
retail checkouts offers the most efficient and accurate means of tracking
sales. Called the retail index, this is the industry standard for market
measurement.
The accuracy of consumer panel data is limited by
the panel size, yet it is richer and better suited for diagnosing buying
behaviour. In research lingo, data of this nature is called disaggregate.
Key brand health measures like brand loyalty, %buyers, volume
per buyer and so on rely on disaggregate data. Other diagnostic analysis
like brand switching, repeat buying rate, share forecasting rely on data that
must be both continuous and disaggregate.
Typically, consumer panels are composed of
households/individuals who are representative of the market in terms of relevant
characteristics such as household size, life stage, income, dwelling type, ethnic
group, geographical location, etc.
The panels in existence today are almost entirely
anchored in the fast moving consumer goods (FMCG) sector. There is a
considerable, as yet largely unexplored potential for panels in sectors such as
finance, telecom and petroleum. Behaviour of usage/consumption of credit cards,
mobile phones and petroleum, can provide valuable information that could help
shape marketing and business decisions in these sectors.
Nielsen, the largest service provider operates FMCG
panels in 28 countries covering about 300,000 households. The first panel was set
up by Nielsen in 1932, in the U.S. The first scan panel, BrandScan
was launched in 1986 in Australia by AGB McNair, which subsequently was
acquired in 1994 by Nielsen. Today the majority of FMCG consumer panels are
scan-based, and the two major service providers are Nielsen and Kantar (TNS).
In addition to home panels there are a few
out-of-home panels for impulse foods like chocolate, ice cream and soft drink
that are consumed out of home.


