
-
Product Validation
Product Validation
Moments of Truth
Launch Validation Methods
Simulated Test Markets
BASES
Controlled Store Test
Product Launch Evaluation
Parfitt-Collins Model
TRB Model
Bass Diffusion Model
- New Product Development
- Product Design
- Product Validation
- Marketing Education
- How to Choose the Right Marketing Simulator
- Self-Learners: Experiential Learning to Adapt to the New Age of Marketing
- Negotiation Skills Training for Retailers, Marketers, Trade Marketers and Category Managers
- Simulators becoming essential Training Platforms
- What they SHOULD TEACH at Business Schools
- Experiential Learning through Marketing Simulators
-
MarketingMind
Product Validation
Product Validation
Moments of Truth
Launch Validation Methods
Simulated Test Markets
BASES
Controlled Store Test
Product Launch Evaluation
Parfitt-Collins Model
TRB Model
Bass Diffusion Model
- New Product Development
- Product Design
- Product Validation
- Marketing Education
- How to Choose the Right Marketing Simulator
- Self-Learners: Experiential Learning to Adapt to the New Age of Marketing
- Negotiation Skills Training for Retailers, Marketers, Trade Marketers and Category Managers
- Simulators becoming essential Training Platforms
- What they SHOULD TEACH at Business Schools
- Experiential Learning through Marketing Simulators
Controlled Store Test
As the name suggests, Controlled Store Test (CST) is a test conducted in-store to assess the potential of an initiative, usually in relation to a new product. It is appealing because of its real-world setting — from the standpoint of a new product launch, the store shelf is the point where the consumers’ initial encounters with the product culminate into the act of buying it.
Applications
CST is particularly useful for fine-tuning elements of the mix, for example:
- Special displays and promotions: Determine which type of displays, promotions, in-store sampling and in-store media work best for the brand.
- Merchandising: Assess the impact on shelf allocation of arrangement such as brands stocked vertically or horizontally.
- Pricing: Evaluation of different price points, types of packaging, product line mix and extensions.
Note that unless a CST is supported with disaggregate transaction data, such as loyalty panel data, that reveals trial and repeat purchase, it does not predict a new product’s expected sales or market share. It only reveals the product’s share over the duration of the test. Since it takes 6 to 12 months for sales of FMCG products to stabilize, CST is not suited for predicting market share of these products.
Methodology

An important prerequisite is the cooperation of one or more retailers as their stores are deployed for test purposes. Their support is crucial to the success of the research programme.
CST methods require controls in place — stock outs and unintended in-store activities that influence sales are not admissible. For a new product, in-store media such as shelf talkers or floor vision will be required to convey the new product’s positioning.
CST is essentially a form of A/B Testing. The matched panel CST is a commonly used approach that requires two matched panels of stores: Control panel and Test panel (refer to Exhibit 11.11). The test panel is where changes to the mix are introduced, whereas the control panel is insulated from these changes. The two panels are matched on a range of criteria including:
- Store size
- Category turnover
- Product range
- Strength of test brand
- Historical trend
- Shopper demographics
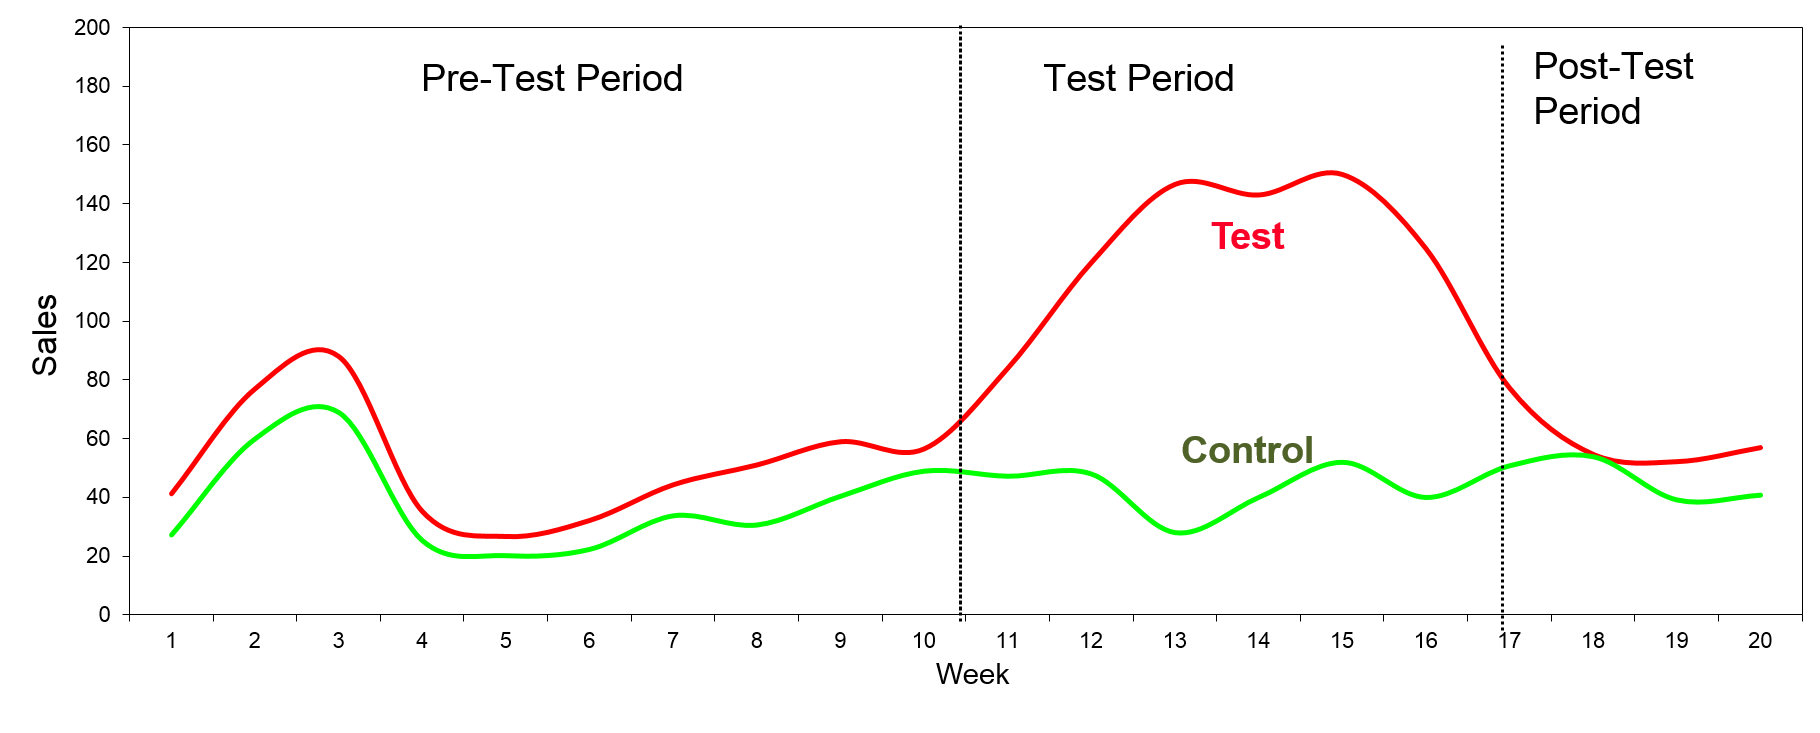
Exhibit 11.12 Analysis of matched panels.
| Average Sales per week | Control Panel | Test Panel |
|---|---|---|
| Pre-Test | 37.8 | 51.1 |
| Test phase | 42.5 | 128.1 |
| Post-Test | 46.2 | 60.3 |
| Sales Index | ||
| Pre-Test | 100 | 100 |
| Test phase | 112.7 | 250.6 |
| Post-Test | 122.3 | 117.9 |
Exhibit 11.13 Sales summary for CST in Exhibit 11.12.
One advantage of matched panel is that it compensates for seasonality and other environmental factors. Analysis is based on sales trend comparison within the two panels, over a duration that covers the test period and time intervals, before and after the test. Hypothesis testing is used to analyse the difference between the two panels and test their significance. (Details of hypothesis testing and the determination of sample size are provided in sections Hypothesis Testing and Sample Size — Comparative Studies in Chapters Basic Statistics and Sampling).
Consider for example the results of a CST depicted in Exhibits 11.12 and 11.13. The special displays and in-store media activities during the test period resulted in sales volume growth of 122% (250.6 over 112.7).
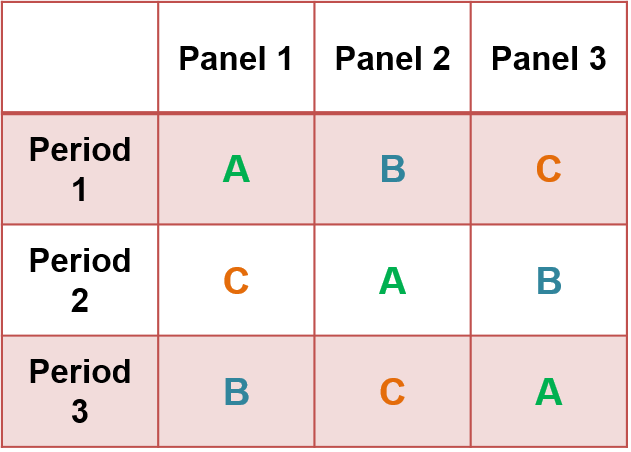
Exhibit 11.14 Example of Latin square for 3 different scenarios
to be tested, say price: A: $10, B: $12.50, C: $15.
Latin squares is another approach to CST where an N × N table (see Exhibit 11.14) is filled with N different scenarios in such a way that each scenario occurs exactly once in each row (time period) and exactly once in each column (panel of test stores). This approach permits simultaneous evaluation of multiple scenarios. It compensates for seasonality as well as idiosyncrasies across different groups of stores.
Case Example
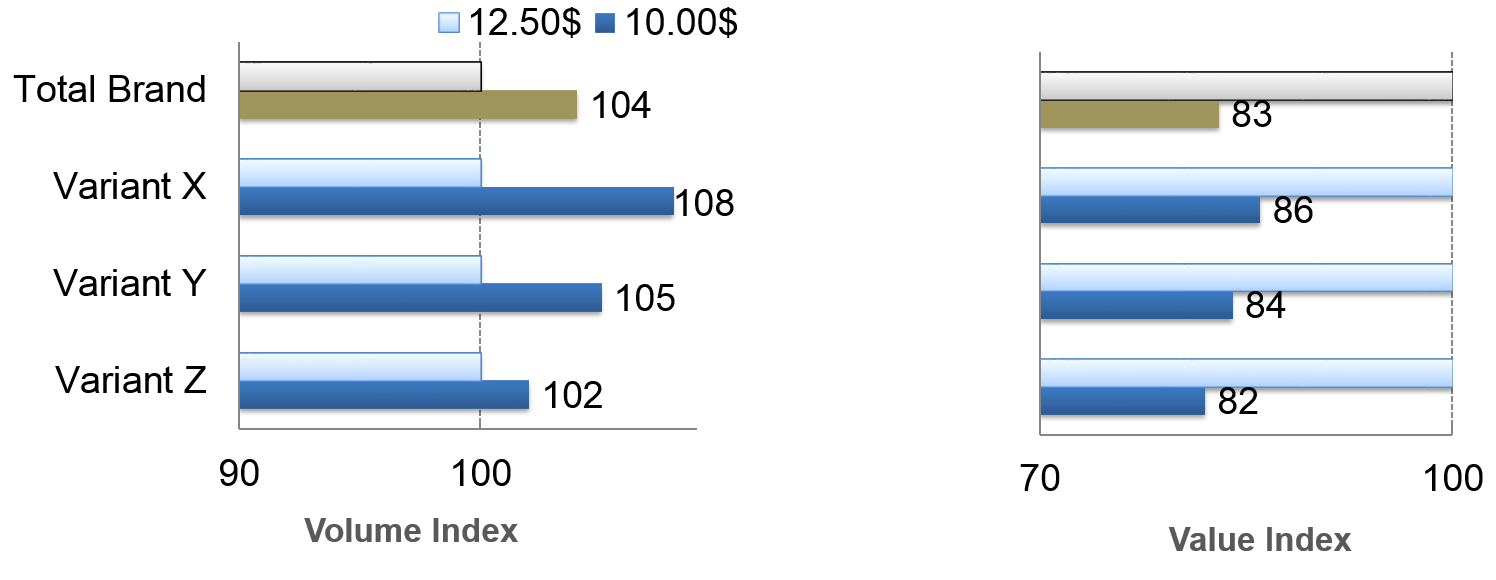
Objective: To measure impact of price ($10.00, $12.50, $15.00) on sales volume and value of a shampoo brand with variants X, Y and Z.
Methodology: Latin Squares.
Analysis in Exhibit 11.15 reveals that this shampoo brand is fairly inelastic. It gains a relatively small 4% in volume, and loses 17% in value, when price is dropped from $12.50 to $10.00, a 20% reduction.
Previous Next
Use the Search Bar to find content on MarketingMind.
Marketing Analytics Workshop
In an analytics-driven business environment, this analytics-centred consumer marketing workshop is tailored to the needs of consumer analysts, marketing researchers, brand managers, category managers and seasoned marketing and retailing professionals.
Digital Marketing Workshop

Unlock the Power of Digital Marketing: Join us for an immersive online experience designed to empower you with the skills and knowledge needed to excel in the dynamic world of digital marketing. In just three days, you will transform into a proficient digital marketer, equipped to craft and implement successful online strategies.


Contact | Privacy Statement | Disclaimer: Opinions and views expressed on www.ashokcharan.com are the author’s personal views, and do not represent the official views of the National University of Singapore (NUS) or the NUS Business School | © Copyright 2013-2024 www.ashokcharan.com. All Rights Reserved.