
-
Brand Equity
Brand Equity
Zen versus i-Pod
Benefits
Loyalty Pyramid
NPI, NAI
Brand Equity Models
Brand Equity Index
Brand Equity Drivers
Analysis and Interpretation
Overview
- Brand Sensing
- Brand Equity
- Marketing Education
- How to Choose the Right Marketing Simulator
- Self-Learners: Experiential Learning to Adapt to the New Age of Marketing
- Negotiation Skills Training for Retailers, Marketers, Trade Marketers and Category Managers
- Simulators becoming essential Training Platforms
- What they SHOULD TEACH at Business Schools
- Experiential Learning through Marketing Simulators
-
MarketingMind
Brand Equity
Brand Equity
Zen versus i-Pod
Benefits
Loyalty Pyramid
NPI, NAI
Brand Equity Models
Brand Equity Index
Brand Equity Drivers
Analysis and Interpretation
Overview
- Brand Sensing
- Brand Equity
- Marketing Education
- How to Choose the Right Marketing Simulator
- Self-Learners: Experiential Learning to Adapt to the New Age of Marketing
- Negotiation Skills Training for Retailers, Marketers, Trade Marketers and Category Managers
- Simulators becoming essential Training Platforms
- What they SHOULD TEACH at Business Schools
- Experiential Learning through Marketing Simulators
Brand Equity Index
The net promoter index is a useful, uncomplicated indicator of brand equity. One may argue that because brand equity is multi-faceted, a series of questions are more appropriate than the single “willingness to recommend” statement used for deriving the net promoter index. In practice, however, it is unlikely to make a substantive difference because the statements used to generate the index are highly correlated.
That said, most brand equity models tend to use a series of three or four statements that reflect the outcomes of brand equity — brand loyalty, willingness to pay a price premium, and the willingness to endure some inconvenience (e.g., travel a distance) to secure the brand. The following statements are used to create NielsenIQ’s Winning Brands’ Brand Equity Index:
- If you have to recommend a brand of [category] to somebody which brand would it be?
- Which brand of [category] would you say is your favourite brand? It may or may not be the brand you use/buy most often.
- Can you please indicate which of these statements best describe how much you would be willing to pay for [brand name]?
- Whatever it costs
- Even if it costs more than any other brand
- I would buy even if it costs a lot more than the cheapest brand
- Even if it costs a bit more than the cheapest brand
- Only if it costs same as the cheapest brand
- I would not buy it at all
- Do not know
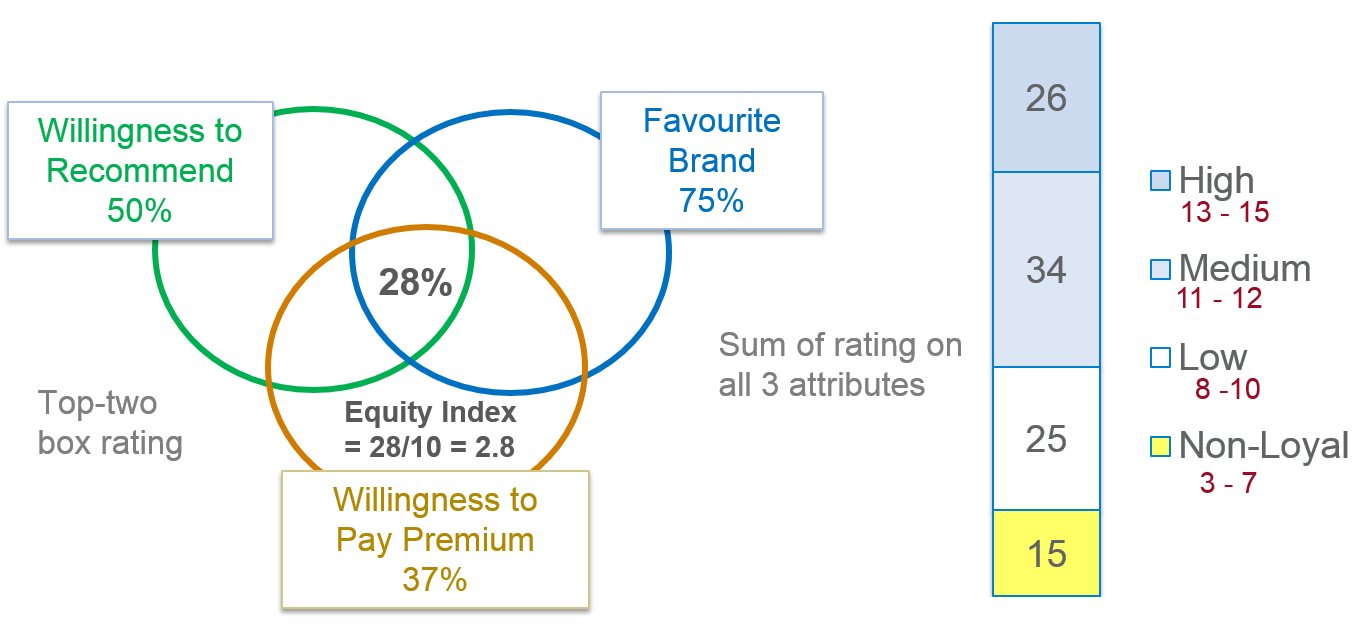
Exhibit 2.9 Equity index based on extent of intersection of the composite measures. Consumer segments derived from Likert scale.
There are a variety of approaches that may be used to craft an index; for instance, as depicted in Exhibit 2.9, the equity index may be based on the size of the intersection of the composite measures. In this example, the intersection — i.e., the percent of respondents who rate the brand within top 2 boxes for all the three statements — is 28%. This intersection value is a reflection of the brand’s equity, and on a 10-point scale, the brand’s equity index (2.8) is computed by dividing this value by 10.
An alternative approach is to take a weighted average of the ratings on the statements used to determine brand equity, where the weights are obtained through factor analysis.
A Likert scale (i.e., the sum of responses to the statements) may be used to segment consumers based on their affinity to the brand. If a 5-point rating scale is used, the Likert scale for the three statements ranges from 3 (1+1+1) to 15 (5+5+5). In the example, the 26% of the respondents with a composite score of 13 to 15 are classified as loyal, 34% (score 11 or 12) are classified as satisfied, 25% (score 8 to 10) are classified as neutral, and the remaining 15% (score 7 or less) are classified as dissatisfied. While there are no hard rules for the cut-offs, it is preferable that the levels are chosen such that respondents are well distributed across each of the groups. The size of the segments, though, tends to be larger in the middle and smaller at the extremes.
Data Interpretation and Analysis
Of prime interest when analysing brand equity data is the assessment of the impact of marketing initiatives on your brand’s equity. To determine what course of action to take to improve your brand’s performance, you will need answers to the following questions:
- What is my brand’s equity and how does it compare with competing brands?
- What are my brand’s (and my competitor’s) strengths and weaknesses?
- Is my brand’s equity improving or deteriorating? Which segments are contributing to the improvement/decline?
- What are the factors contributing to the improvement or the decline in equity?
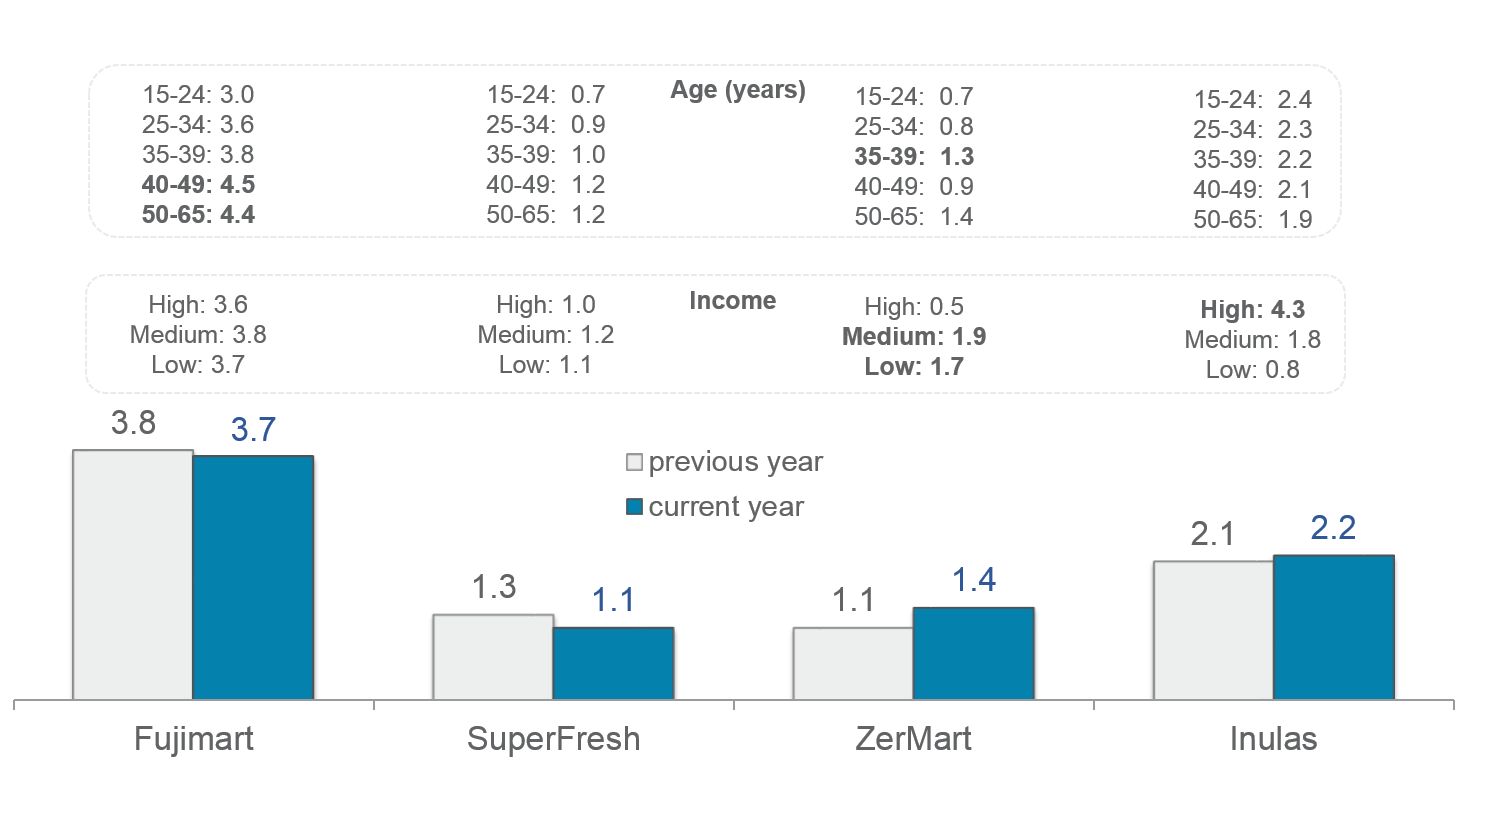
Exhibit 2.10 depicts the store equity indices of some stores based on the NielsenIQ equity index. The indices, as you will notice, are low for most stores; only Fujimart crosses 3 on this 10-point scale. This reflects the reality in the marketplace. Only a few brands have an equity index that exceeds 3, most brands hover below 1. A ten on this scale would mean that everybody in the market is a loyal customer of the brand and would willingly pay a significant price premium, whereas a zero means that there are no loyal customers, and nobody would pay any more than the cheapest price for that brand.
The variations in equity across the demographic groups shown in Exhibit 2.10, reveal the strengths and weaknesses of the brands. Referring back to Exhibit 2.3, observe also how the trends in store equity are reflected in the movements in the loyalty pyramid.
Previous Next
Use the Search Bar to find content on MarketingMind.
Marketing Analytics Workshop
In an analytics-driven business environment, this analytics-centred consumer marketing workshop is tailored to the needs of consumer analysts, marketing researchers, brand managers, category managers and seasoned marketing and retailing professionals.
Digital Marketing Workshop

Unlock the Power of Digital Marketing: Join us for an immersive online experience designed to empower you with the skills and knowledge needed to excel in the dynamic world of digital marketing. In just three days, you will transform into a proficient digital marketer, equipped to craft and implement successful online strategies.


Contact | Privacy Statement | Disclaimer: Opinions and views expressed on www.ashokcharan.com are the author’s personal views, and do not represent the official views of the National University of Singapore (NUS) or the NUS Business School | © Copyright 2013-2024 www.ashokcharan.com. All Rights Reserved.