
-
Biometrics
Biometrics
Eye Tracking
How it Works
Devices
Metrics
Fixations and Saccades
Heat Maps
Pupillometry
Eye Language
Applications
Electroencephalography
Frequency-based Analysis
Metrics
Approach-Avoidance
Cognitive-Affective
Facial Coding
Facial Expressions
Facial Action Coding System
Metrics
Analysis
Applications
Galvanic Skin Response
Devices
Analysing GSR Signals
Metrics
Applications
Biometrics — Applications
- How Advertising Works
- Advertising Analytics
- Packaging
- Biometrics
- Marketing Education
- Is Marketing Education Fluffy and Weak?
- How to Choose the Right Marketing Simulator
- Self-Learners: Experiential Learning to Adapt to the New Age of Marketing
- Negotiation Skills Training for Retailers, Marketers, Trade Marketers and Category Managers
- Simulators becoming essential Training Platforms
- What they SHOULD TEACH at Business Schools
- Experiential Learning through Marketing Simulators
-
MarketingMind
Biometrics
Biometrics
Eye Tracking
How it Works
Devices
Metrics
Fixations and Saccades
Heat Maps
Pupillometry
Eye Language
Applications
Electroencephalography
Frequency-based Analysis
Metrics
Approach-Avoidance
Cognitive-Affective
Facial Coding
Facial Expressions
Facial Action Coding System
Metrics
Analysis
Applications
Galvanic Skin Response
Devices
Analysing GSR Signals
Metrics
Applications
Biometrics — Applications
- How Advertising Works
- Advertising Analytics
- Packaging
- Biometrics
- Marketing Education
- Is Marketing Education Fluffy and Weak?
- How to Choose the Right Marketing Simulator
- Self-Learners: Experiential Learning to Adapt to the New Age of Marketing
- Negotiation Skills Training for Retailers, Marketers, Trade Marketers and Category Managers
- Simulators becoming essential Training Platforms
- What they SHOULD TEACH at Business Schools
- Experiential Learning through Marketing Simulators
Electroencephalography (EEG)
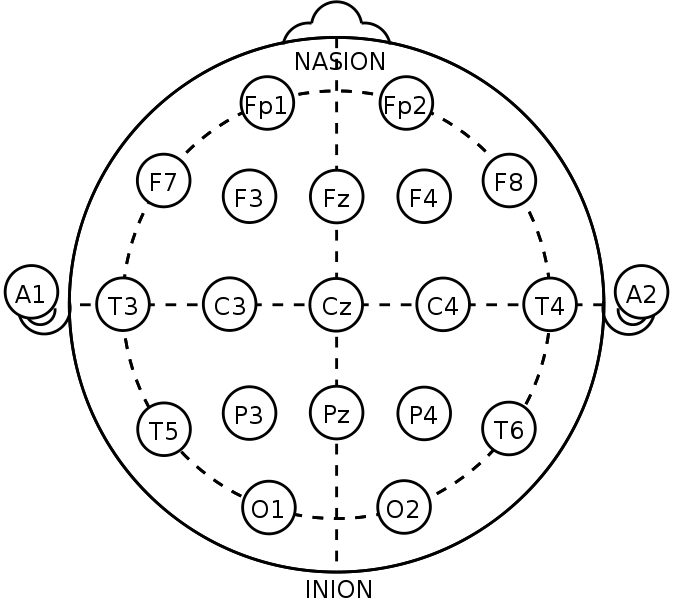
Exhibit 15.11 Electrode locations of for EEG recording according to the international 10-20 system. (Source: Wikipedia).
Electro-encephalo-graphy literally means writing of the electric activity of the brain. It is an imaging technique using electrodes placed on the scalp, which captures, amplifies and records the electric signals emitted by neurons in the brain.
The 10-20 system shown in Exhibit 15.11 is the internationally recognized standard for placement of electrodes. The names indicate the brain region or lobes where the electrodes are located: Frontopolar (Fp), Frontal (F), Temporal (T), Parietal (P), Occipital (O), and Central (C). The number or letter represents the hemisphere (odd = left hemisphere, even = right hemisphere), and the distance to the midline.
The actual distances between adjacent electrodes are either 10% or 20% (10-20 system) of the total front–back or right–left distance of the skull. The front–back measurement is taken from the nasion (depression between eyes and nose) to inion (bump at back of head), and the right–left measurement is from the right to the left preauricular points (just above the top of the earlobes).
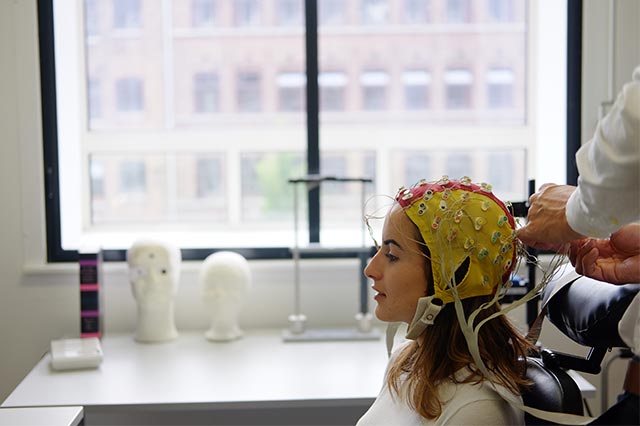
Contemporary devices such as the EEG measurement cap (Exhibit 15.12) are attached snuggly to the head and consist of electrodes (sensors) that transmits the captured brain activity. They provide for high time resolution, and compared to other imaging technologies, are better able to capture physiological changes in the brain.
EEGs are appropriate for capturing signals about attention, arousal, fatigue and surprise, which are emitted from the brain’s surface. They are not as effective in picking up signals from deeper within the brain, that are key for decision making. EEGs therefore are better suited for testing feelings and emotions, and not appropriate for testing informational content that requires thinking.
This section provides a brief description of how EEGs work. For a more details download EEG, The Complete Pocket Guide, by iMotions. The pocket guide is also a prime source for the information provided in this section.
Frequency-based Analysis
The roughly 100 billion interconnected neurons in our brain constantly emit electric signals. These signals comprise a mixture of several underlying base frequencies, lying between 1 to 80 Hz that vary in magnitude (voltage). They are classified into frequency bands associated with different cognitive-affective states of mind.
Of the different ways that these synaptic waves are analysed by EEG devices, frequency-based analysis is of greatest relevance to consumer research. It is better suited for detecting emotions, thoughts, and motivations in relation to the testing of advertising and packaging, product testing, and the design and navigation of websites. By analysing the different frequency bands of the brain's electrical activity, EEG can provide insights into the cognitive and emotional responses of consumers to marketing stimuli.
The frequencies are classified into these five bands:
- Delta (1 – 4 Hz): These slow, high amplitude brainwaves are present only when the subject is in deep sleep, i.e., technically speaking, stage 3 or non-REM (non-rapid eye movement) sleep. The stronger the delta rhythm, the deeper the sleep. Since memory consolidation occurs while we sleep, delta frequencies are associated with the formation of long-term memories, including biographic memory and procedural memory.
- Theta (4 – 8 Hz): Oscillations in the theta range relate to mental workload and working memory. They correlate with the level of difficulty of the mental task, with theta power increasing as the task becomes more challenging. Theta activity is also associated with cognitive processing, attention, and memory retrieval. In consumer research, theta rhythms can be used to assess the level of cognitive effort required to process marketing stimuli such as product information, pricing, and promotional offers.
- Alpha (8 – 12 Hz): These frequencies correlate with mental and physical relaxation with eyes closed. When alpha activity is prominent, the brain is in a state of rest and is not processing any specific information. Conversely, alpha blocking or suppression relates to activities with eyes open when the brain is focussed and ready to absorb information. When alpha waves decrease, it indicates that the brain is engaged in active mental processing. Alpha rhythms are commonly used in consumer research to assess the level of attention and engagement with marketing stimuli such as advertisements, product packaging, and website designs.
- Beta (12 – 25 Hz): Frequencies in this range correlate with active or anxious thinking that requires concentration. Beta activity is associated with cognitive functions such as attention, focus, and working memory. It is also observed when the subject is thinking about executing movements demanding motor skills. In consumer research, beta rhythms can be used to assess the level of mental effort and engagement required to process marketing stimuli such as advertisements, product packaging, and website designs.
- Gamma (above 25 Hz): This is a relatively grey area. There is lack of consensus among researchers as to what mental activities these frequencies relate to.
The analysis can be broken down in the following stages:
- Clean and prepare the data.
- Breakdown the total duration of the analysis into smaller time periods or epochs. For instance, a one-minute advertisement is broken into 60 two-second epochs, each overlapping by 1 second.
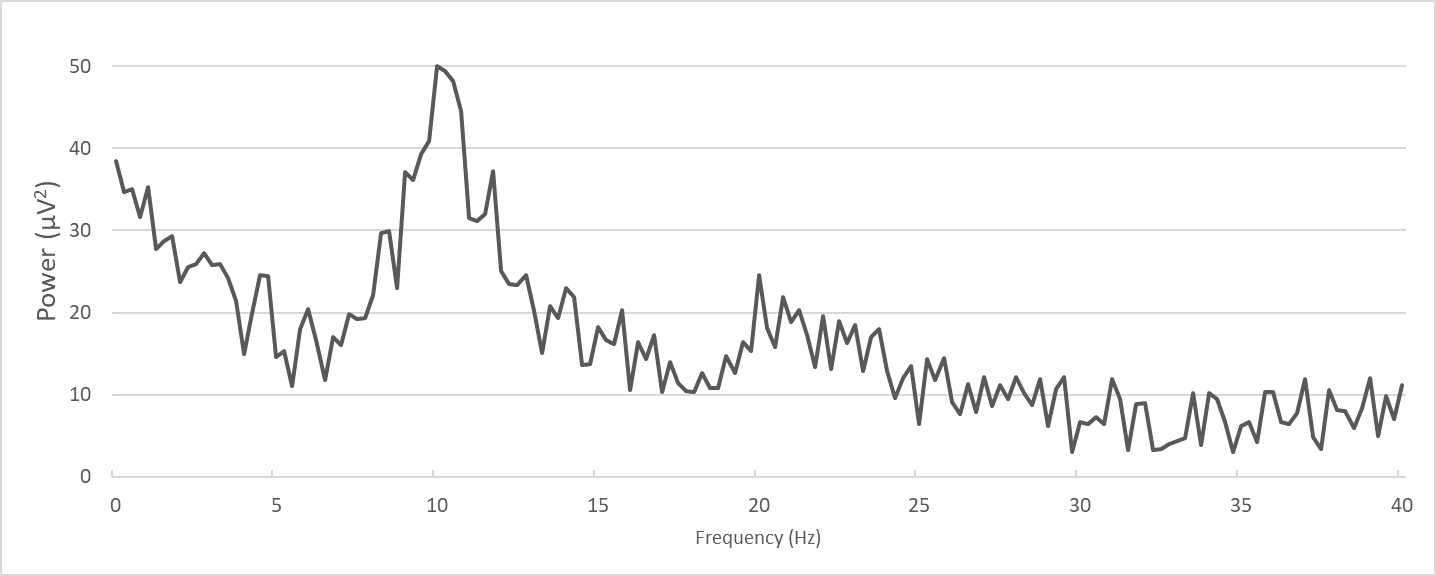
- Fast Fourier Transformation (FFT) is applied to transform the EEG signals for the epochs into their frequency domain, which can be represented by frequency-amplitude charts similar to one in Exhibit 15.12. This data is captured across epochs, across electrodes and across respondents. By analysing the frequency distribution of the EEG signals, researchers can gain insights into the cognitive and emotional responses of consumers to marketing stimuli.
- Compute the metrics. Some of the better-known metrics include:
- frontal asymmetry index for approach-avoidance behaviour,
- cognitive state for engagement and distraction,
- cognitive workload.
- Plot the metrics across the epochs (time periods) to visualize how the state of mind varies over the duration of the stimulus. The data is usually averaged across respondents, and for an overall index, it is averaged over the epochs.
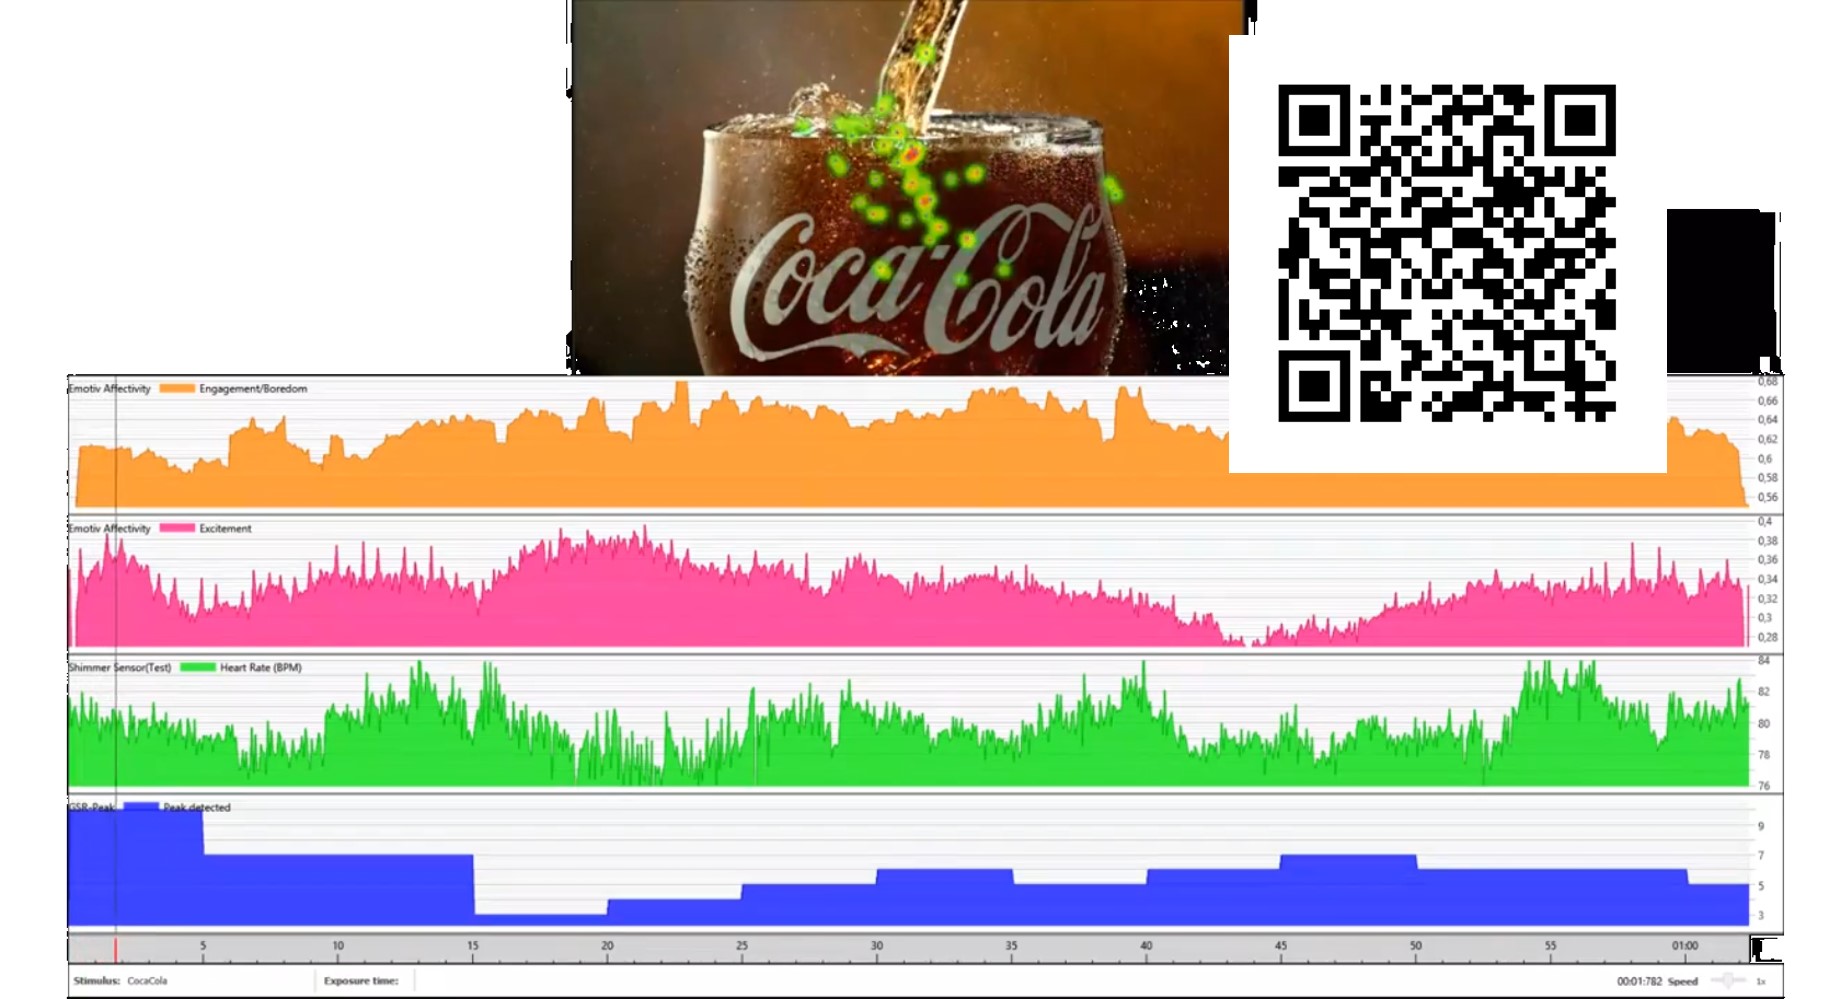
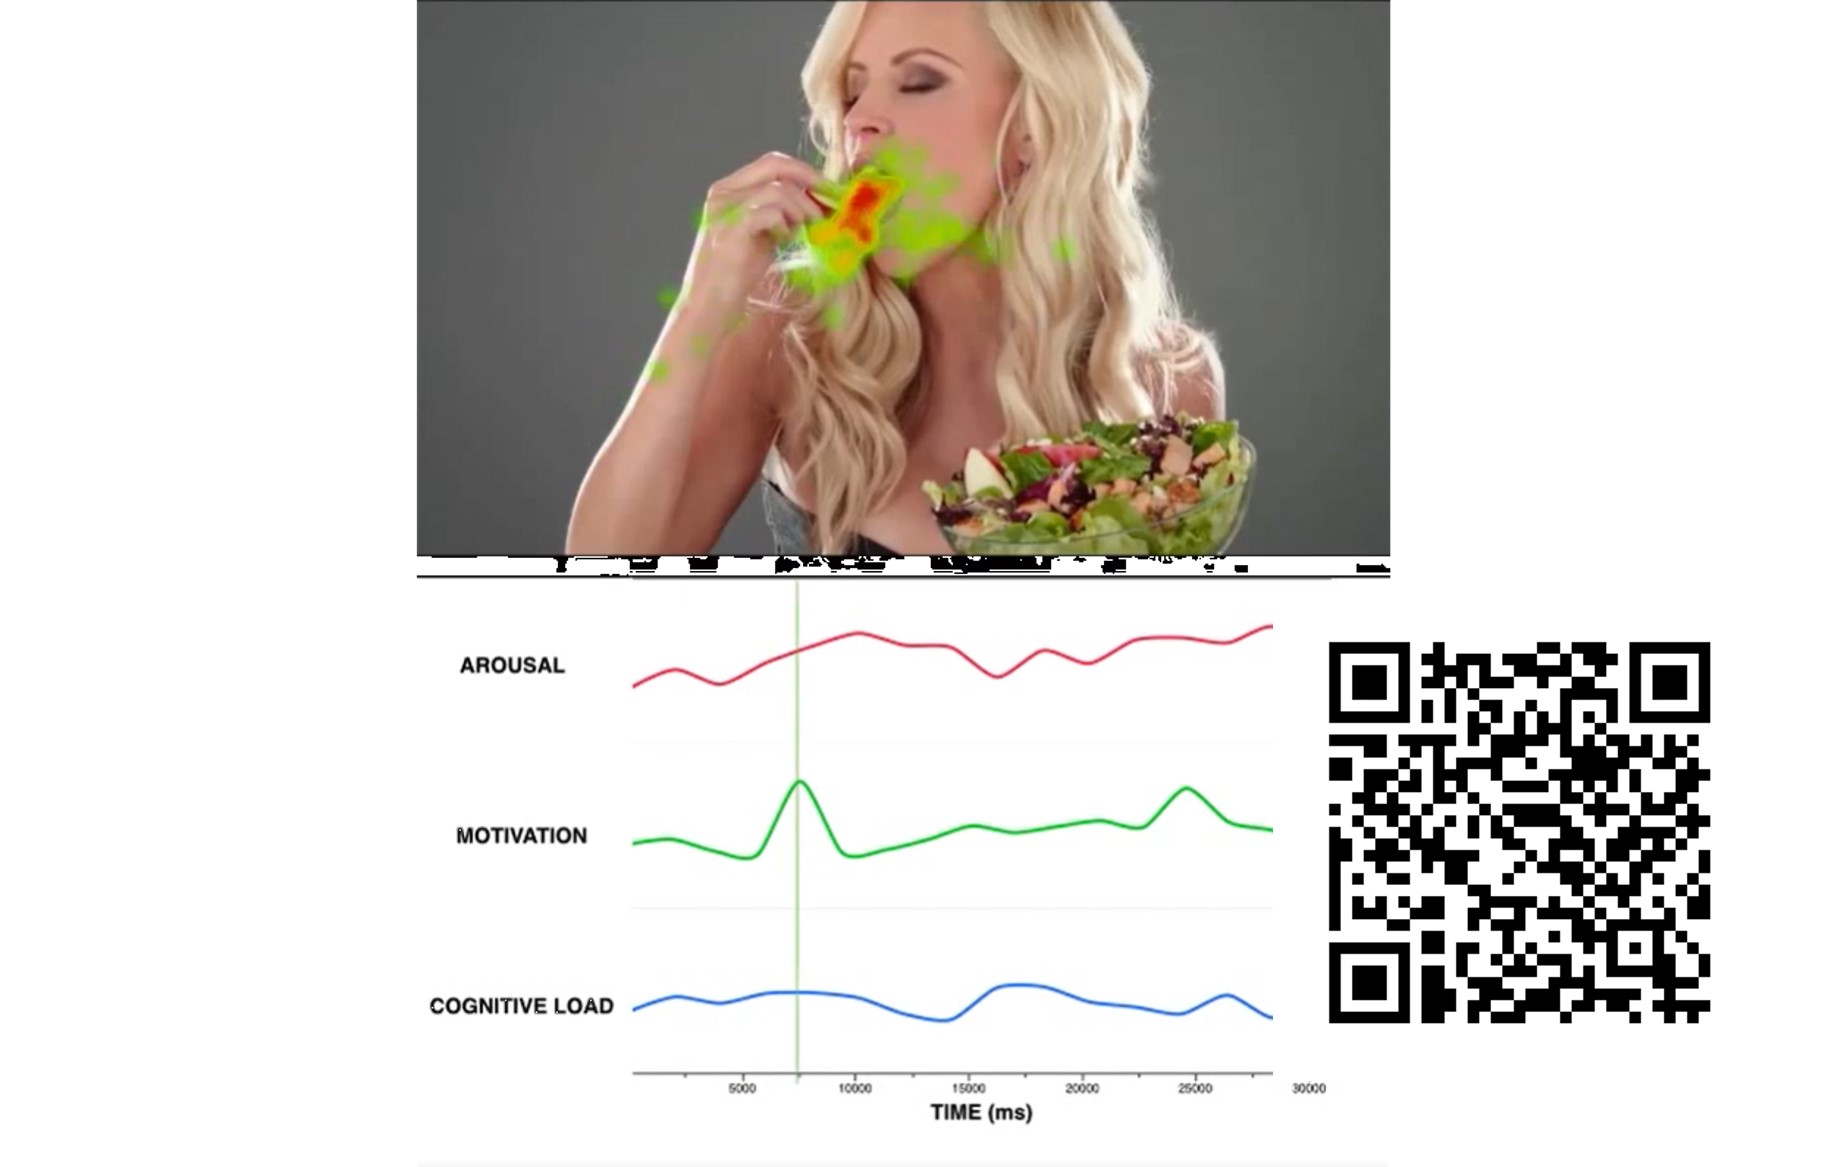
As can be seen from the findings of the studies on Coca-Cola and Carls Jr TVCs (shown in exhibits 15.14 and 15.15), the research combines EEG with eye tracking in order to determine which visuals are eliciting a higher degree of cognitive engagement and arousal. The EEG signals from the electrodes are aggregated into emotional states, such as arousal, motivation, and cognitive load, for the Carls Jr TVC. These emotional states are then tracked over the course of the advertisements, providing analysts with valuable insights into how viewers are responding to the content.
Metrics
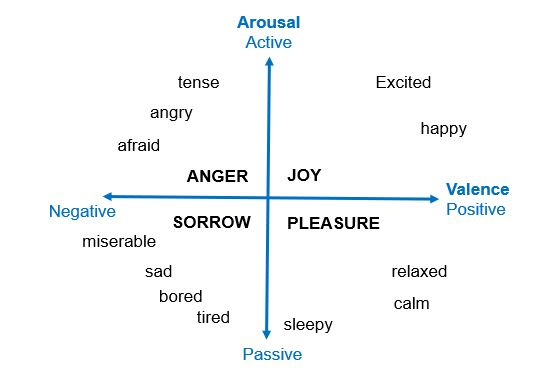
Different service providers may use different terms for EEG metrics, but these metrics generally correspond to cognitive-affective states such as approach-avoidance behaviour, engagement and distraction, and cognitive workload. A physiological taxonomy of emotions, as shown in Exhibit 15.16, depicts approach-avoidance along the x-axis and cognitive state along the y-axis.
Frontal Asymmetry — Approach-Avoidance
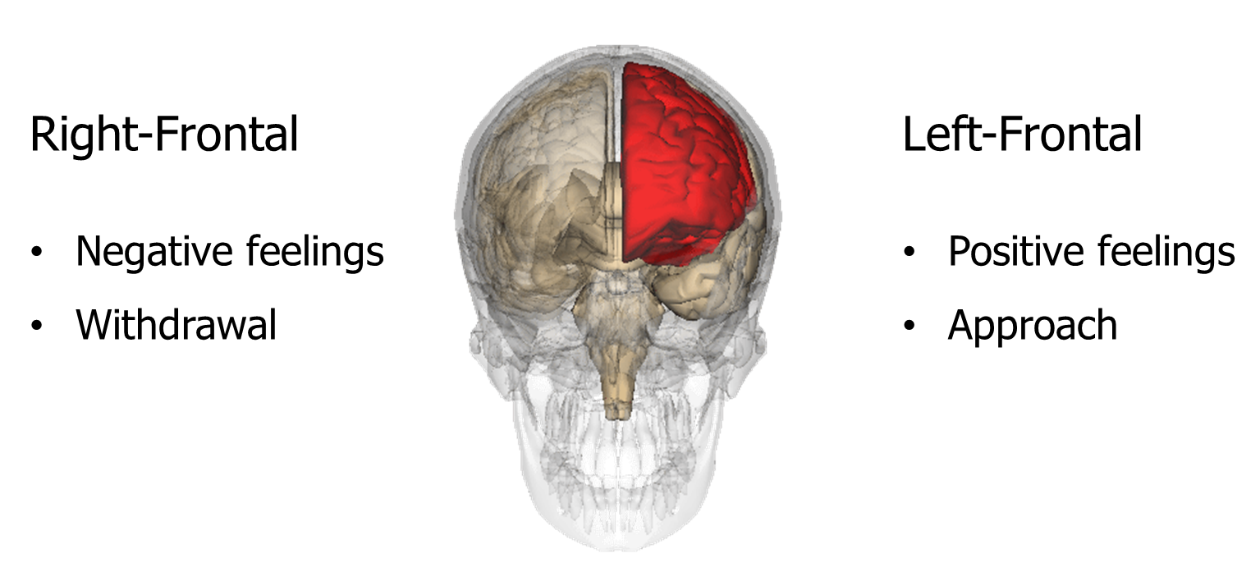
Exhibit 15.17 Activity in the left/right-frontal brain reveal approach-avoidance tendencies. (Source: adapted from iMotions, image from Wikipedia).
The frontal asymmetry reveals insights into the subject’s motivations, emotions and engagement. As depicted in Exhibit 15.17, increased activity in the left-frontal indicates positive feelings, engagement and motivation, and the reverse is true for the right-frontal. This relationship serves as a useful index of approach and avoidance:
$$ Frontal \,Asymmetry \,Index \,(FAI) = log \left(\frac {alpha \,power \,right \,F4}{alpha \,power \,left \,F3}\right) $$A higher FAI typically indicates a positive disposition to stimuli, while a lower index indicates a negative disposition. This metric is derived by extracting signals from the electrodes F3/F4 and F7/F8.
In addition to the FAI, the beta (12-25 Hz) or gamma (> 30 Hz) band power, particularly in the frontal cortical regions (electrodes F3 and F4), are good indicators for the motivation towards (approach) or away from (avoidance) any stimulus.
These metrics are used for evaluating advertising and packaging, as well as for product testing. They provide an unbiased indicator of the respondent’s emotional and motivational disposition towards a new product.
Cognitive-Affective
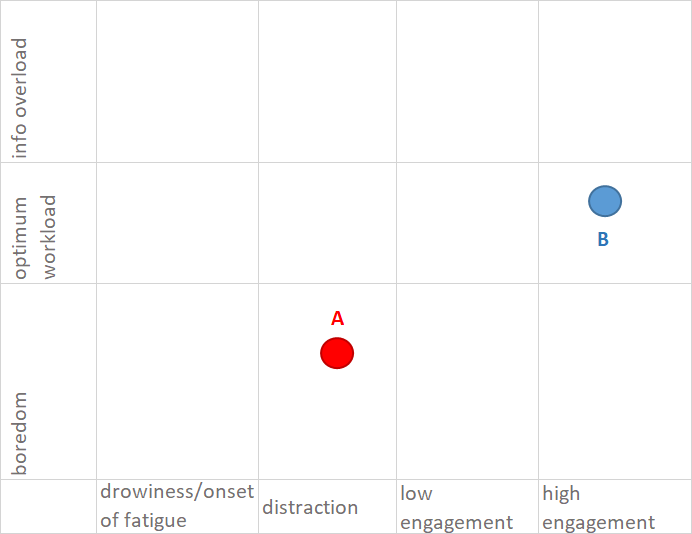
Exhibit 15.18 Cognitive-affective rating for two advertisements, based on scales used by Advanced Brain Monitoring’s B-Alert EEG.
Cognitive-affective metrics pertain to the cortical processes underlying mental workload or drowsiness. They provide a measure of the level of fatigue, attention, engagement and workload that the respondent’s brain is experiencing.
Cognitive States: Advanced Brain Monitoring’s (ABM) B-Alert EEG uses a scale ranging from 0 to 1 to gauge the extent that the respondent is tuned-out/attentive. There are 4 cognitive states on this scale — drowsiness & fatigue onset, distraction, low engagement and high engagement. Each of these states is characterized by different signals. The signs of drowsiness and fatigue for instance include higher delta band activity and theta bursts.
Workload: ABM also adopts a workload scale, also from 0 to 1, that gauges cognitive processes dealing with working memory, problem solving and analytical reasoning. There are 3 workload states — boredom, optimum and stress/information overload. This scale correlates with theta band activity; as theta power increases, so does workload.
Plotted over the epochs, these metrics show how cognitive affective states change over the duration of a stimulus such as a video advertisement.
The overall performance may be summarized by taking the averages across the epochs. This allows for comparison across two or more stimuli. Exhibit 15.18, for instance, where ad B with high overall level of engagement and optimum workload, out-performs ad A which is distracting and relatively boring.
Previous Next
Use the Search Bar to find content on MarketingMind.


Contact | Privacy Statement | Disclaimer: Opinions and views expressed on www.ashokcharan.com are the author’s personal views, and do not represent the official views of the National University of Singapore (NUS) or the NUS Business School | © Copyright 2013-2026 www.ashokcharan.com. All Rights Reserved.