
-
Biometrics
Biometrics
Eye Tracking
How it Works
Devices
Metrics
Fixations and Saccades
Heat Maps
Pupillometry
Eye Language
Applications
Electroencephalography
Frequency-based Analysis
Metrics
Approach-Avoidance
Cognitive-Affective
Facial Coding
Facial Expressions
Facial Action Coding System
Metrics
Analysis
Applications
Galvanic Skin Response
Devices
Analysing GSR Signals
Metrics
Applications
Biometrics — Applications
- How Advertising Works
- Advertising Analytics
- Packaging
- Biometrics
- Marketing Education
- Is Marketing Education Fluffy and Weak?
- How to Choose the Right Marketing Simulator
- Self-Learners: Experiential Learning to Adapt to the New Age of Marketing
- Negotiation Skills Training for Retailers, Marketers, Trade Marketers and Category Managers
- Simulators becoming essential Training Platforms
- What they SHOULD TEACH at Business Schools
- Experiential Learning through Marketing Simulators
-
MarketingMind
Biometrics
Biometrics
Eye Tracking
How it Works
Devices
Metrics
Fixations and Saccades
Heat Maps
Pupillometry
Eye Language
Applications
Electroencephalography
Frequency-based Analysis
Metrics
Approach-Avoidance
Cognitive-Affective
Facial Coding
Facial Expressions
Facial Action Coding System
Metrics
Analysis
Applications
Galvanic Skin Response
Devices
Analysing GSR Signals
Metrics
Applications
Biometrics — Applications
- How Advertising Works
- Advertising Analytics
- Packaging
- Biometrics
- Marketing Education
- Is Marketing Education Fluffy and Weak?
- How to Choose the Right Marketing Simulator
- Self-Learners: Experiential Learning to Adapt to the New Age of Marketing
- Negotiation Skills Training for Retailers, Marketers, Trade Marketers and Category Managers
- Simulators becoming essential Training Platforms
- What they SHOULD TEACH at Business Schools
- Experiential Learning through Marketing Simulators
Eye Tracking — Metrics
Eye tracking quantifies visual attention, with the most common metrics being fixations and saccades. Fixations refer to the stable points where the eye remains fixated for a period of around 100 milliseconds or more, while saccades refer to the rapid movements between fixations.
Fixations and Saccades
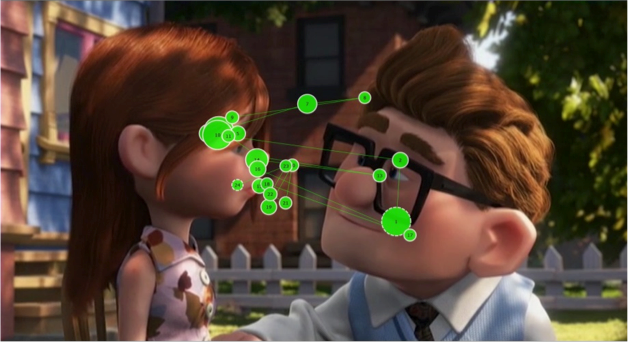
Exhibit 15.8 Gaze plot of a viewer in a scene from the movie Up. (Source: How we came to Eye Tracking Animations — Craig Batty, Claire Perkins and Jodi Sita.)
Gaze point is the basic unit of measure of eye gaze. If the eye tracker has a sampling frequency of 60 Hz, it captures 60 gaze points per second (or one every 16.67 milliseconds).
A cluster of gaze points, close in time and space, constitutes a fixation. While there is no precise cut-off defining a fixation, it is believed that durations less than 300ms do not get encoded in memory. In practice, devices are recoding fixations for periods of 100ms or more.
The eye movements between fixations are called saccades. They are the lines that connect the different fixations.
When viewing an image or reading a text, longer fixation time might mean that the object in focus is more engaging, or it could indicate difficulty in understanding or extracting information. More fixations indicate that the object is more noteworthy, whereas faster time to first-fixation means that it better at grabbing attention.
A scan path or gaze plot describes the user’s gaze pattern as a saccade-fixate-saccade sequence represented by lines and bubbles, where the size of the bubble indicates the fixation duration. The gaze plot in Exhibit 15.8 involves a jerky movement from one fixation to another. This is typical of most visual images and videos. Similarly, while reading text, eyes tend to jump and pause.
When driving a vehicle, on the other hand, eyes fixate constantly on the road or the vehicle in front. There are much fewer saccades and a smoother, more concentrated scan path.
Heatmaps
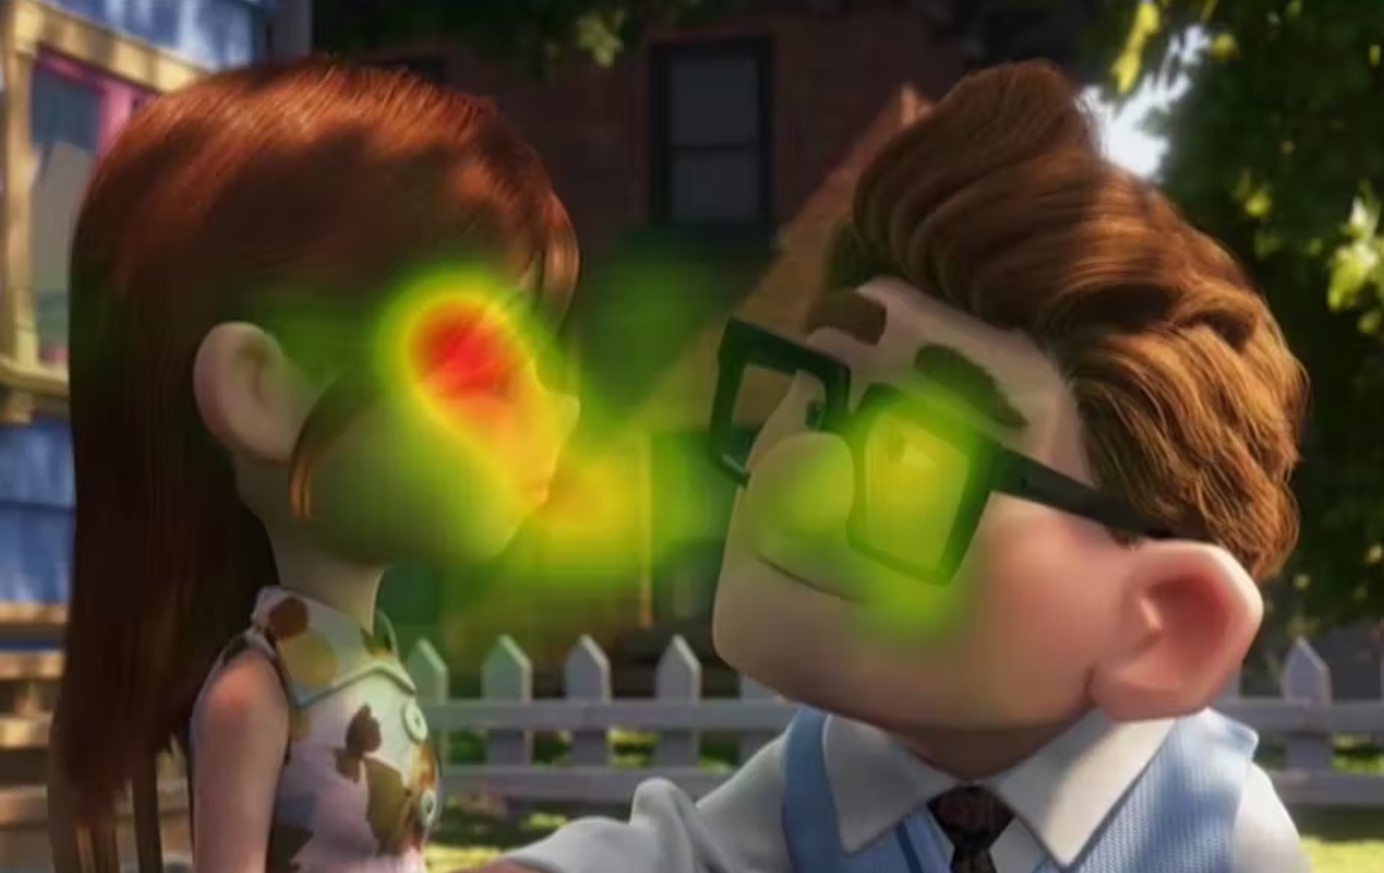
Exhibit 15.9 Heatmaps depict hot spots of areas that are grabbing eyeballs. (Source: Dr Jodi Sita, Australian Catholic University.)
Heatmaps like the one in Exhibit 15.9, represent the areas of the visual that are viewed most. They depict the aggregate gaze points through a colour scheme where warm colours like red and yellow indicate hot spots or areas that are viewed more often and for longer periods.
The “heat intensity” is equal to the proportion of participants fixating the area of interest times the average fixation duration, or time spent.
These metrics are of considerable relevance to marketing analysts. Advertisers, for instance, design layouts so that higher proportion of viewers (proportion fixating) see the value proposition or the key messages in the advertisement. Similarly packaging designers want their packaging to stand out on the shelf. It is important for both, that the key elements in their content are red hot spots.
Pupillometry
Our pupils respond to light, dilating when it is dark and constricting when it is bright. Pupils also respond to emotional arousal and cognitive or mentally taxing activity. They dilate when the mind is emotionally charged or cognitively stimulated, and the extent of dilation is proportional to the intensity of the arousal. It is an autonomic process that cannot be consciously controlled.
Pupillometry, which measures the dilation of the pupil, can provide an assessment of emotional arousal, provided that the impact of lighting is taken into account. However, it is important to note that pupillary responses do not reveal the specific nature of the emotions being experienced. Therefore, it is necessary to combine pupillometry with other conventional or biometric research techniques, to gain a more detailed understanding of emotions.
Eye Language
Besides pupillary responses, eye trackers measure a range of other aspects of body language, or more specifically, “eye language” that provide insights into the user’s state of mind. One of these is ocular vergence, which is tracked by measuring the inter-pupillary distance. When the eyes move apart (divergence), it can signal that the user’s mind is drifting, losing focus, or lacking concentration.
Eye trackers also monitor frequency of blinks, which can reveal information about the user’s mental state. Delayed or “attentional” blinking is indicative of mentally taxing work, while low-frequency blinking indicates deeper levels of concentration. Conversely, high frequency blinking is associated with boredom, drowsiness and low concentration levels.
Another body metric that can be measured is the distance between the eyes and the screen, which reflects the user’s posture. Leaning forward is often a sign of positive resolution or a higher level of interest, while leaning backward may suggest negativity or an inclination to avoid. By analysing these various aspects of eye language, eye tracking can provide a more nuanced understanding of the user’s behaviour and mental state.
Previous Next
Use the Search Bar to find content on MarketingMind.


Contact | Privacy Statement | Disclaimer: Opinions and views expressed on www.ashokcharan.com are the author’s personal views, and do not represent the official views of the National University of Singapore (NUS) or the NUS Business School | © Copyright 2013-2026 www.ashokcharan.com. All Rights Reserved.