
-
Brand Sensing
Pink Diamonds
New Coke
Brand
Positioning
Brand Image Tracking
Image Profiling
Perceptual Maps
Thums Up
Brand Health
- Brand Sensing
- Brand Equity
- Marketing Education
- Is Marketing Education Fluffy and Weak?
- How to Choose the Right Marketing Simulator
- Self-Learners: Experiential Learning to Adapt to the New Age of Marketing
- Negotiation Skills Training for Retailers, Marketers, Trade Marketers and Category Managers
- Simulators becoming essential Training Platforms
- What they SHOULD TEACH at Business Schools
- Experiential Learning through Marketing Simulators
-
MarketingMind
Brand Sensing
Pink Diamonds
New Coke
Brand
Positioning
Brand Image Tracking
Image Profiling
Perceptual Maps
Thums Up
Brand Health
- Brand Sensing
- Brand Equity
- Marketing Education
- Is Marketing Education Fluffy and Weak?
- How to Choose the Right Marketing Simulator
- Self-Learners: Experiential Learning to Adapt to the New Age of Marketing
- Negotiation Skills Training for Retailers, Marketers, Trade Marketers and Category Managers
- Simulators becoming essential Training Platforms
- What they SHOULD TEACH at Business Schools
- Experiential Learning through Marketing Simulators
Brand Image Tracking
Brand image as stated earlier is the consumers’ perception of the brand. Products deliver a set of benefits — functional, rational, emotional, personality, and brand-consumer relationship benefits. The image of a brand relates to how it is perceived on these benefits or attributes.
The objective of brand image tracking is to measure consumers’ perception of brands through its association with relevant attributes. This is done via quantitative studies where respondents are asked to rate brands on a wide battery of attributes, on a 5 (or 7 or 10) point agree-disagree rating scale. For instance, in a shampoo study, a typical question may be as follows:
Please rate the following brands of shampoo on each of the statements using a scale of 1 to 5, where:
1 means “Strongly disagree”,
2 means “Disagree”,
3 means “Neither agree nor disagree”,
4 means “Agree” and
5 means “Strongly agree”
a) Using [brand] makes my hair Shiny and Lustrous
b) [Brand] makes my hair beautiful
c) [Brand] prevents dandruff …
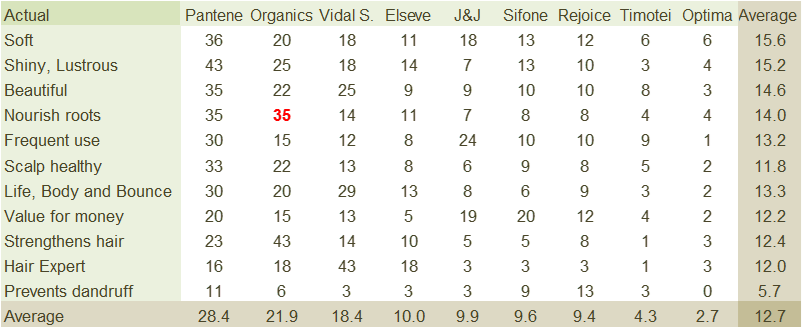
Exhibit 1.5 Top 2 boxes (Strongly Agree/Agree)
ratings for shampoo brands in a study for Organics shampoo.
To analyse the data, we usually review the Top 2 Box (T2B) score. This summarizes the 5 numbers in the rating scale, combining the top 2 responses, “Strongly Agree” and “Agree”, to create a single score. For instance, with reference to the table in Exhibit 1.5, which summarizes the results for a shampoo study, 36% of respondents either “Agree” or “Strongly Agree” with the statement “Pantene makes hair soft”.
Determining Product Attributes
The product attributes for a brand image tracking study are selected on the basis of their relevance to the study objectives. For instance, if the purpose pertains to advertising and positioning, a broad spectrum of functional and emotional attributes that drive brand choice should be selected. For studies pertaining to product development, focus would shift to product design attributes. Brand owners would typically include the core attributes of their brand as well as those of their direct the core attributes of their brand as well as those of their direct competitors, i.e., attributes of relevance to the segment their brand is targeting.
In case of an ongoing research, the attribute list is refined about once a year to reflect changes in emphasis in advertising as well as changes in consumers’ needs and preferences.
Usage and attitude studies are usually a good source of information on the attributes that consumers deem important. If, however, no prior information is available or if there is the need to update existing attribute lists, exploratory attitudinal research (qualitative in nature) using focus group discussions, sometimes in combination with physical observation, can help unearth the aspects of a product that consumers find most important.
The Organics study, Exhibit 1.5, centred on functional attributes because the brand’s advertising highlighted its functional benefits. Organics was positioned as a brand that “strengthens hair” and “nourishes roots”.
Choice of Brands
Typically, for image tracking, marketers would include competing brands from the target segment.
The data in Exhibit 1.5 pertains to a study for Organics shampoo which was a mainstream brand. So, for this study one would tend to include other standard or mainstream products like Pantene and exclude brands which target specialty segments such as anti-dandruff, medicated or kids. Hence the exclusion of Head and Shoulder, a major brand which falls under the anti-dandruff shampoo segment.
Image Profiling
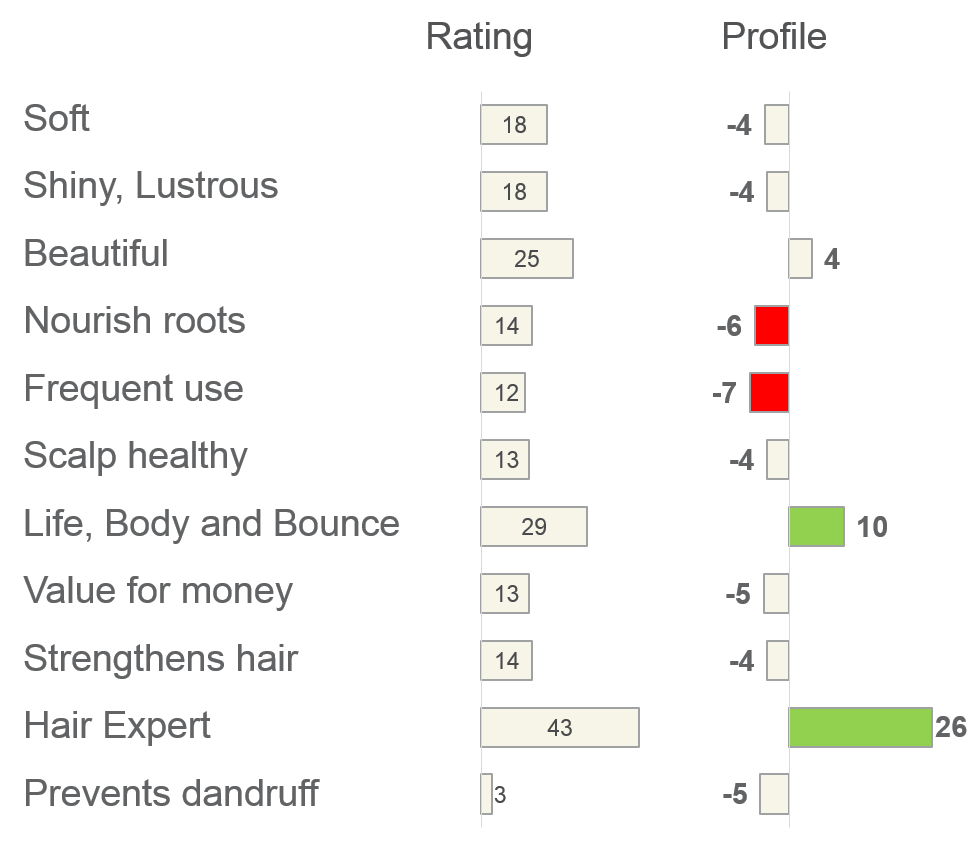
The bare numbers depicted in Exhibit 1.5 are not particularly easy to assimilate. Because numbers in general are hard to process, market researchers employ techniques to depict data in a meaningful and visual form that our minds find easier to comprehend.
One method used in the context of drawing a brand’s personality, is image profiling, a technique that transforms image rating data to reveal the relative strengths and weaknesses of brands. Observe for instance Exhibit 1.6, which depicts the image profile of Vidal Sassoon. Presentation of data in this form makes it easier to deduce that relative to competing brands, this brand is perceived as the “hair expert” and a brand that “adds life, body and bounce”. It is not perceived as “suitable for frequent use”.
The objective in image profiling is to determine what features distinguish one brand from another. While a big brand like Pantene is rated high on all attributes, our aim is to know which of these attributes distinguish it from other brands.
We are aware that people comment more on familiar brands — brand size influences image endorsement. Similarly brands in general are associated more strongly with some attributes (the generic attributes) than others. Image profiling mathematically eliminates influence of brand and attribute “size” to determine each brand’s strengths and weaknesses in relation to each other, expressed as variation from what one would expect if the brand were average.

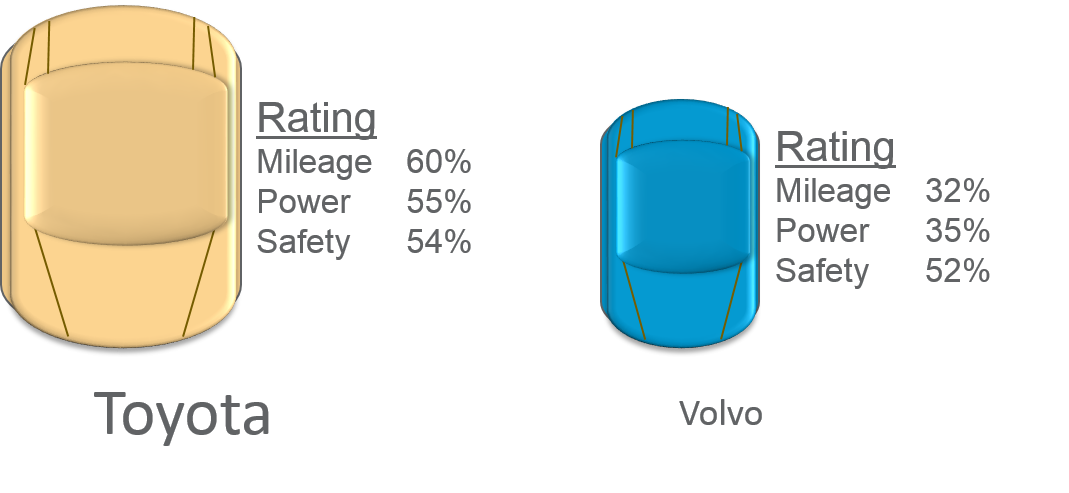
For instance, in Exhibit 1.7, because Toyota is a bigger selling brand, its ratings are generally higher than those for Volvo. With regard to safety, both brands have similar absolute ratings, but relative to brand size, Volvo’s rating on safety is higher — it is the feature that distinguishes Volvo from Toyota. In terms of image profile, it would rate substantially higher than Toyota on this attribute.
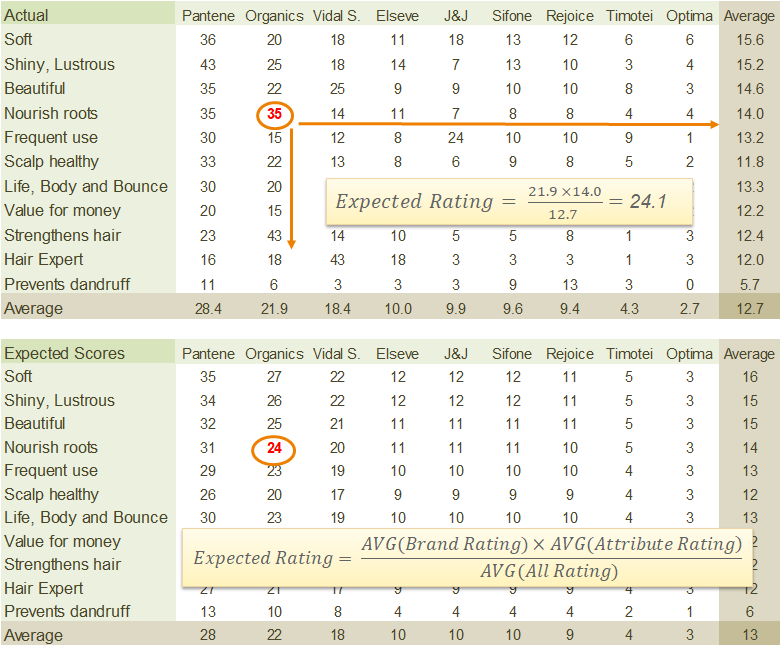
Deriving image profile is a two-step process:
- Compute the “expected” rating. This reflects the attribute rating that
brand would attain if it was totally undifferentiated. It is computed as follows:
Expected Rating =AVG (Brand Rating) × AVG (Attribute Rating) / AVG (ALL Rating)
In the Volvo example the average brand rating is 39.7, the average rating for the attribute safety is 53, and the overall average is 48. So, Volvo’s expected rating on Safety is:
Expected Rating = 39.7 × 53/48 = 43.8
- Profile rating is the difference between the expected rating and the actual rating. In the case of Volvo, because the actual rating (52) is substantially higher than the expected rating (43.8), the brand’s profile on safety is a high positive (+8.2 = 52 − 43.8). Take note that the profile eliminates the influence of brand and attribute size. This can be seen from totals, which equal zero, across columns (brands) as well as across rows (attributes).
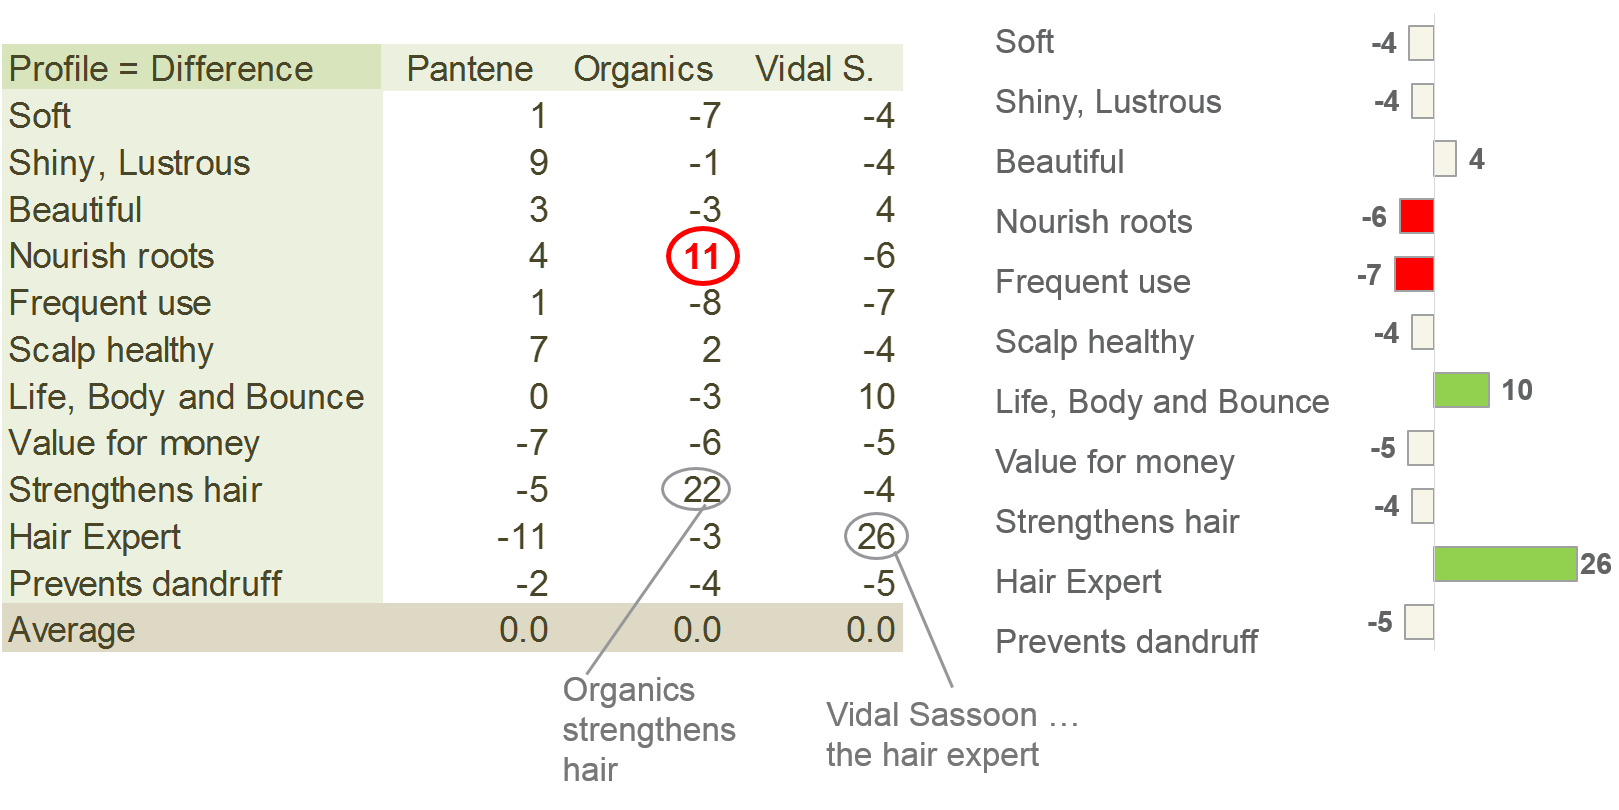
Reverting to our shampoo example, exhibits 1.8 and 1.9 illustrate how Expected Rating and Profile are computed for Organics shampoo on the attribute “nourish roots”. This data tells us that Organics is perceived strong on attributes such as “strengthens hair” and “nourishes roots” and relatively weak on “frequency of use” and “value for money”.
Profile rating provides useful understanding of the relative strengths and weaknesses of a brand’s image across attributes. This is particularly useful in the context of brand positioning and advertising.
Comparisons Across Time
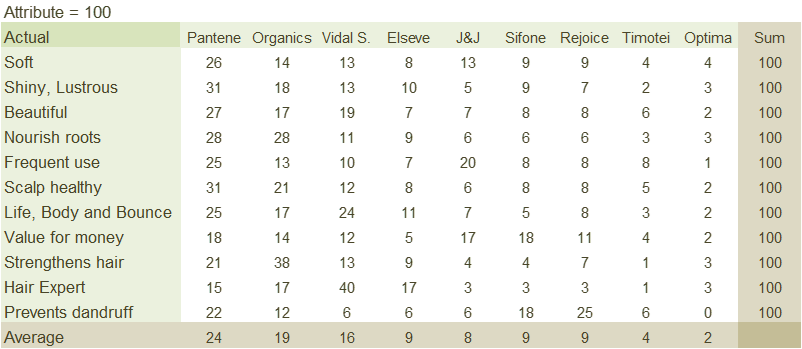
Exhibit 1.10 (Attribute = 100) Share of attribute rating across brands for a particular time period
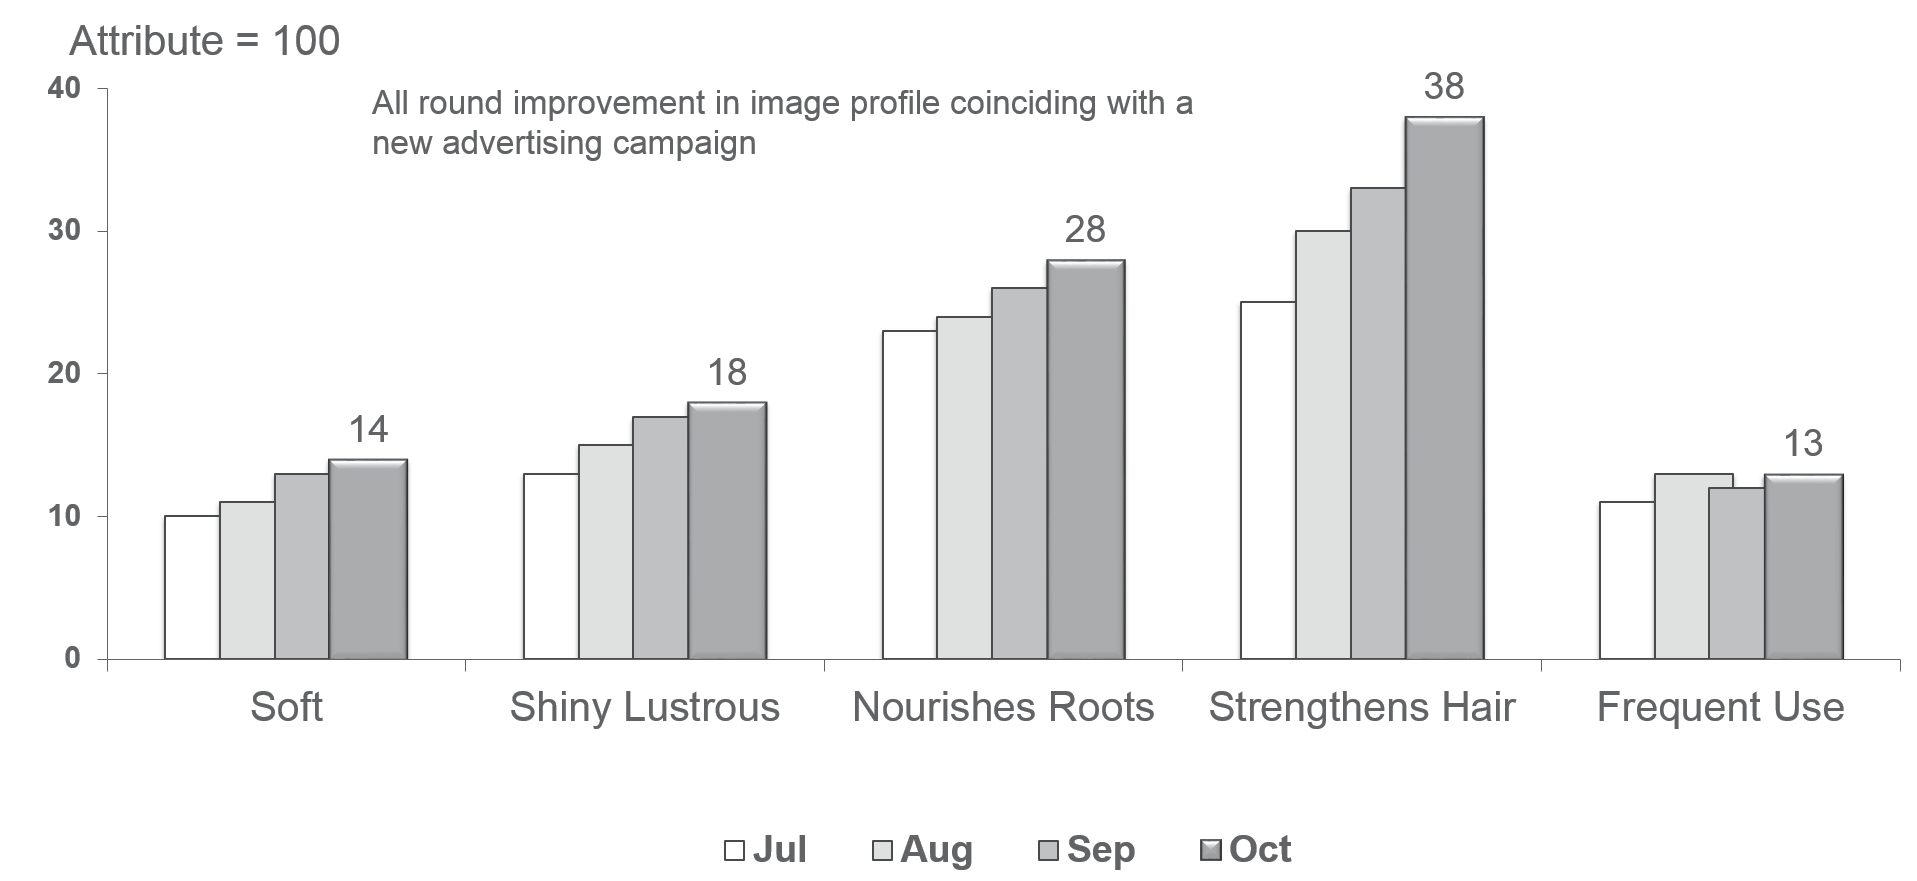
Exhibit 1.11 (Attribute = 100) Share of attribute rating across time for Organics
There is usually some volatility in data due to sampling and non-sampling errors. This becomes pronounced when we compare ratings across time periods. For instance, the average rating for all brands may fluctuate from one period to another. Such cross-period fluctuations can be significantly reduced if the data is presented in terms of share of attribute rating (also referred to as ‘Attribute = 100’), as shown in Exhibits 1.10 and 1.11.
In terms of interpretation, Exhibit 1.10 reveals that Organics’ share of ratings (on top 2 boxes) varies from a high of 38% for “strengthens hair” to a low of 12% on “prevents dandruff”. Comparisons across time (Exhibit 1.11) reveal that with the exception of “frequent use”, the brand is strengthening considerably across the selected set of attributes.
The accuracy of the image ratings varies depending on the sample size. The usual standard is to maintain tolerance levels of 3% to 5% at a confidence level of 90% or 95%. Apart from sampling, the research is subject to a variety of other errors including the interviewer’s style or his or her demeanour, recording errors, incorrect response by respondents, coding errors and so on. Details about these sampling and non-sampling errors are covered in the article on sampling.
Previous Next
Use the Search Bar to find content on MarketingMind.


Contact | Privacy Statement | Disclaimer: Opinions and views expressed on www.ashokcharan.com are the author’s personal views, and do not represent the official views of the National University of Singapore (NUS) or the NUS Business School | © Copyright 2013-2026 www.ashokcharan.com. All Rights Reserved.