
-
Customer Satisfaction
Retention and Attrition
Evolution of Customer Satisfaction
Customer and Employee Satisfaction
Customer Loyalty
Customer Satisfaction Research
Transaction Survey
Relationship Survey
Drivers — Customer Loyalty
Interpretation & Recommendation
Kano Model
Customer Value
Customers’Purchasing Philosophy
Value-in-Use Analysis
Value Assessment
Customer Value Management
Customer Lifetime Value
- Segmentation
- Qualitative Research
- Quantitative Research
- Customer Satisfaction and Customer Value
- Consumer Panels and Consumer Analytics
- Big Data and Consumer Analytics
- Marketing Education
- Is Marketing Education Fluffy and Weak?
- How to Choose the Right Marketing Simulator
- Self-Learners: Experiential Learning to Adapt to the New Age of Marketing
- Negotiation Skills Training for Retailers, Marketers, Trade Marketers and Category Managers
- Simulators becoming essential Training Platforms
- What they SHOULD TEACH at Business Schools
- Experiential Learning through Marketing Simulators
-
MarketingMind
Customer Satisfaction
Retention and Attrition
Evolution of Customer Satisfaction
Customer and Employee Satisfaction
Customer Loyalty
Customer Satisfaction Research
Transaction Survey
Relationship Survey
Drivers — Customer Loyalty
Interpretation & Recommendation
Kano Model
Customer Value
Customers’Purchasing Philosophy
Value-in-Use Analysis
Value Assessment
Customer Value Management
Customer Lifetime Value
- Segmentation
- Qualitative Research
- Quantitative Research
- Customer Satisfaction and Customer Value
- Consumer Panels and Consumer Analytics
- Big Data and Consumer Analytics
- Marketing Education
- Is Marketing Education Fluffy and Weak?
- How to Choose the Right Marketing Simulator
- Self-Learners: Experiential Learning to Adapt to the New Age of Marketing
- Negotiation Skills Training for Retailers, Marketers, Trade Marketers and Category Managers
- Simulators becoming essential Training Platforms
- What they SHOULD TEACH at Business Schools
- Experiential Learning through Marketing Simulators
Drivers of Customer Loyalty and Customer Satisfaction
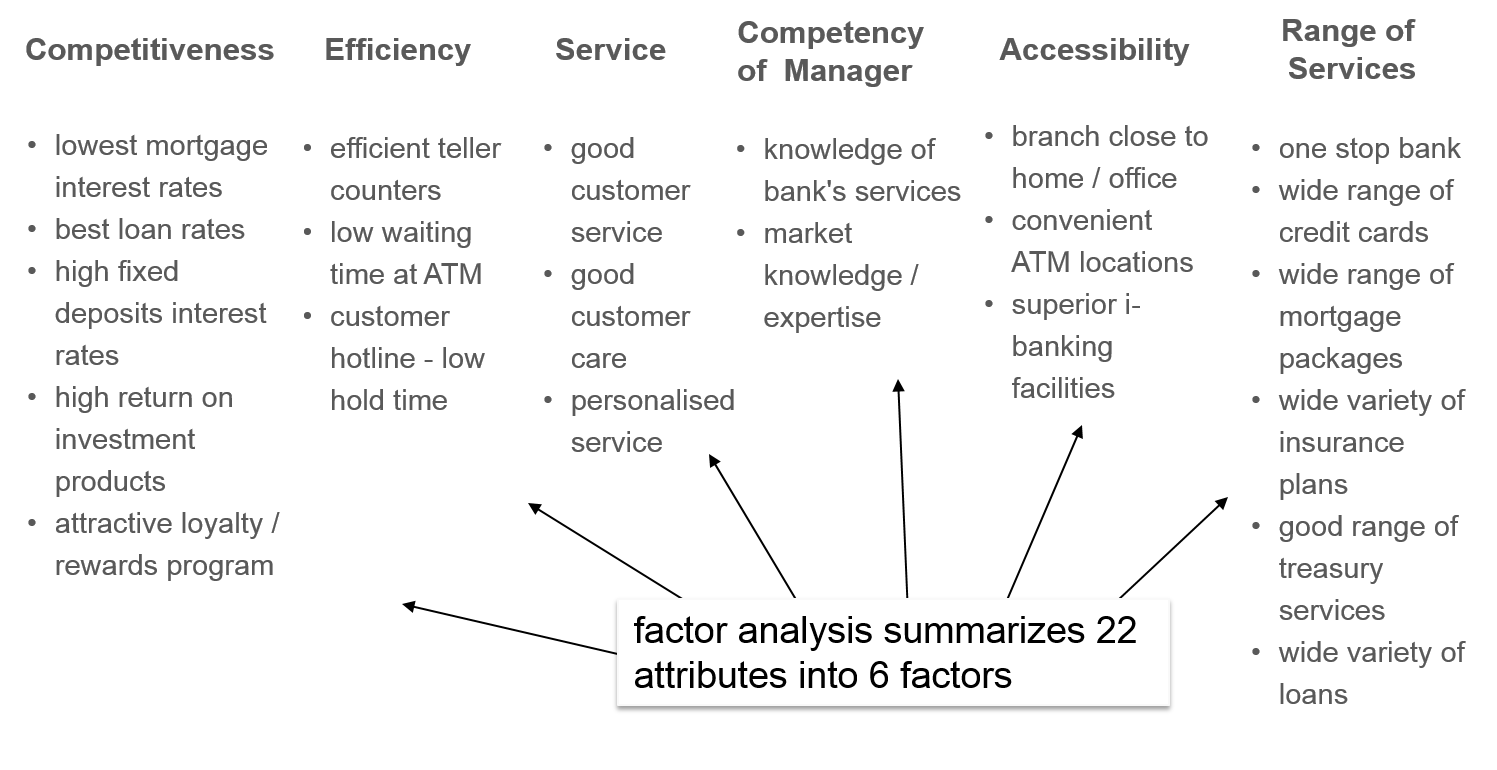
Exhibit 6.8 Large number of attributes summarized through factor analysis.
Customer satisfaction surveys yield a lot of useful information. For instance:
- How satisfied your customers are on different aspects and attributes of your products and services.
- The type of problems your customers are facing and how they are being resolved.
- How loyal your customers are and whether or not their loyalty is improving.
- How key metrics compare with the competitors that you benchmark against.
In addition to all this valuable information, management needs to know the factors that drive customer loyalty. Only then can they prioritize resources and initiatives in products/services development and people development.
Derived importance models employ statistical techniques such factor analysis to summarize many attributes into fewer factors (Exhibit 6.8) and multiple regression to determine the impact of each factor on an outcome such as customer loyalty. The relationship can be represented by equations of the type depicted in Exhibit 6.9.
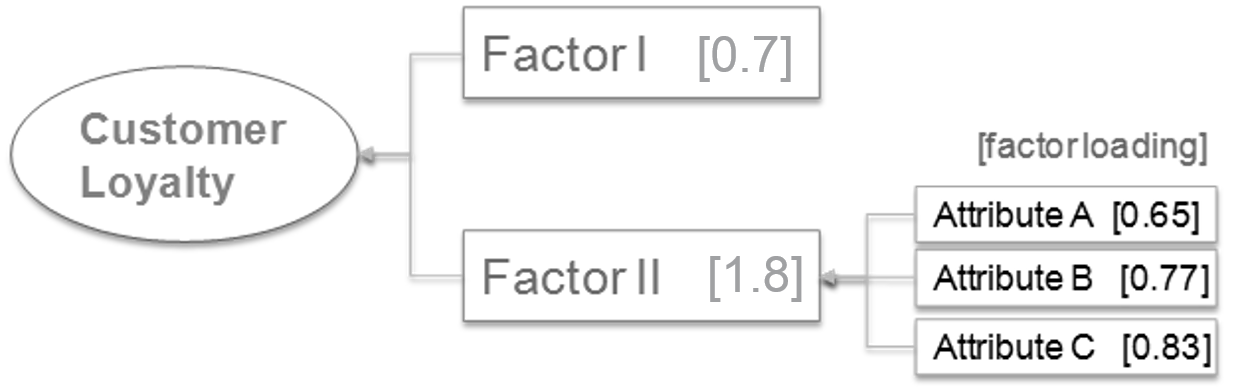


Exhibit 6.9 Derived importance models determine the importance of attributes in driving business outcomes, for instance customer loyalty as shown above.
In this illustration the model reveals the importance of two factors in driving customer loyalty. The coefficients in the equations (0.7 for Factor I and 1.8 for Factor II) determine the importance of each factor, and the factor loading of Attributes A, B and C of (0.65, 0.77 and 0.83 respectively) on Factor II reveal the relative importance of these attributes. This model tells us that Attribute C is more important than Attributes B and A, and Factor II is much more important than Factor I in driving the loyalty index.
There are a number of analytic techniques that may be employed to determine the relationship between each individual attribute (predictor variable) and outcomes such as Loyalty Index or Overall Satisfaction (outcome variable). Some of the commonly used methods are listed below:
- Correlation: establishes the relationship between outcome and predictor variable and expresses the magnitude and direction of the relationship. The squared correlation coefficient which reflects the proportion of variance shared by the outcome and predictor variable, is a measure of relative importance.
- Partial Correlation: The squared partial correlation coefficient reflects the proportion of variance shared by the outcome and predictor variable, after excluding the effects of remaining variables.
- Multivariate Regression: The predictor variables are regressed on the outcome variable to derive the importance or contribution of each predictor to the outcome. The output of a multivariate regression is a model of the type depicted in Exhibit 6.9, where the magnitude of the coefficients of regression reflects the importance of the variables. This is the primary approach used in customer satisfaction research.
- Hierarchical Bayes Regression: subsumes two levels of parameter estimates — the individual (i.e., each respondent) and aggregate. The individual-level coefficients, which reflect the individual’s behaviours and attitudes, may be used to segment consumers. The aggregate-level coefficients are parallel to those derived using multiple regression analysis. Hierarchical Bayes is useful for heterogeneous populations. It is a resource-intensive algorithm that is gaining popularity, now that computers are much more powerful than they used to be.
Derived importance framework can be used in various ways with relationship and transaction surveys, to prioritize resources and business initiatives. A common application is to determine the products and services that have greatest impact in driving customer satisfaction. Reverting to the example of retail banking, the coefficients (b1, b2, b3 … and d1, d2, d3 …) of the following multivariate regression model, indicate the importance of the banking services in driving overall satisfaction, and the importance of relationship manager (RM) attributes in driving “Overall Satisfaction of RM”:
$$ \begin{aligned} \text{Overall Satisfaction} = & f\{\text{Overall satisfaction of Teller (T),}\\ & \text{Overall Satisfaction of Relationship Manager (RM),}\\ & \text{Overall Satisfaction of Credit Card (CC),}\\ & \text{Overall Satisfaction of Deposit (D),}\\ & \text{Overall Satisfaction of Investment (I),}\\ & \text{Overall Satisfaction of Mortgage (M),}\\ & \text{Overall Satisfaction of ATM (A) …}\}\\ & = a + b_1 T + b_2 RM + b_3 CC + b_4 D … \end{aligned} $$ $$ \begin{aligned} \text{Overall Satisfaction of RM} = & f\{\text{Customer Service (CS),}\\ & \text{Customer Care (CC), Personalised Service (PS),}\\ & \text{Transaction time (TT), Knowledge of market,}\\ & \text{Knowledge of bank's products and services …}\}\\ & = c + d_1 CS + d_2 CC + d_3 PS + d_4 TT … \end{aligned} $$To diagnose issues, it is often useful to construct derived importance models for a specific group of respondents (e.g., a loyalty, behavioural, or demographic segment). For instance, to determine the factors contributing to dissatisfaction among respondents in the “dissatisfied” segment, a derived importance model would need to be crafted for that loyalty segment.
It is also desirable to test for interactions that involve two or more variables. For example, if a customer transacting with a relationship manager experiences good personalized service (PS), and during the same interaction receives useful tips on market developments Knowledge of market (KM), the combined effect may be greater than the sum of the parts. This synergistic impact is captured with the use of an interaction term (PS × KM). Since these interactions do exist, modellers need to test for their presence.
One of the issues with customer satisfaction data is the high incidence of collinearity, i.e., the existence of significant relationships among two or more predictor variables. Signs of collinearity include the presence of coefficients with reversed signs, large margins of error on the coefficients and hypersensitivity. The impact of harmful collinearity is mitigated by using analytical approaches such as ridge regression and principal component regression.
Previous Next
Use the Search Bar to find content on MarketingMind.
Customer Experience - Visualization
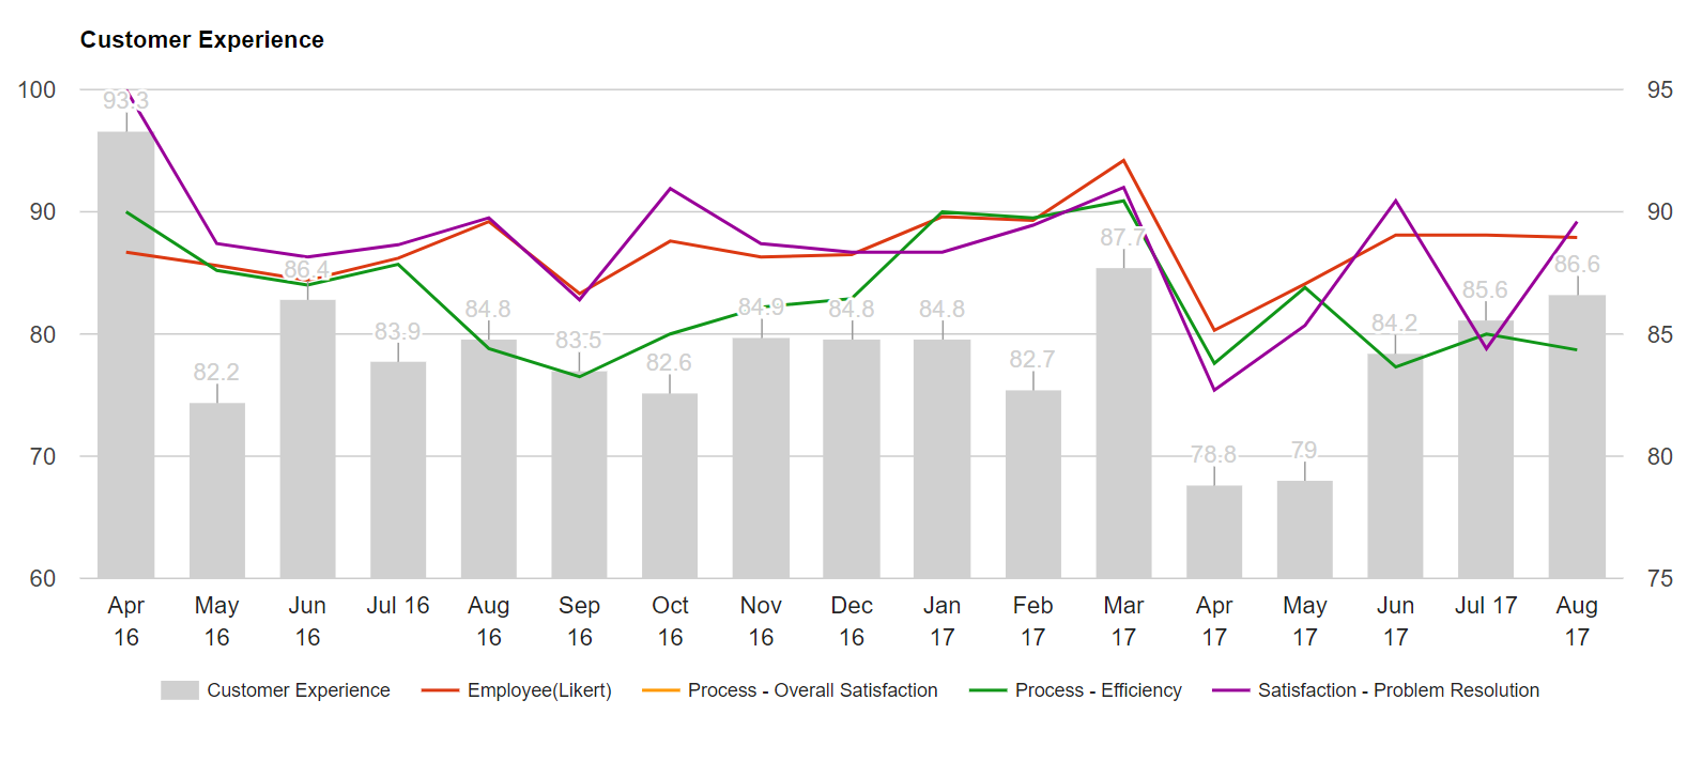
Reporting, analysis and visualization solutions for customer satisfaction research.


Contact | Privacy Statement | Disclaimer: Opinions and views expressed on www.ashokcharan.com are the author’s personal views, and do not represent the official views of the National University of Singapore (NUS) or the NUS Business School | © Copyright 2013-2026 www.ashokcharan.com. All Rights Reserved.