
-
Retail Tracking
Retail Tracking
The Nielsen Code
Applications of Retail Tracking
Where to Measure Sales?
Retail Measurement Services
Retail Universe
Retail Census
Sample Design — Retail Tracking
Data Collection — Retail Tracking
Data Processing — Retail Tracking
Data Projection — Retail Tracking
Analysis and Interpretation — Retail Tracking
Numeric and Weighted Distribution
In-Stock and Out-of-Stock Distribution
Coverage Analysis — Retail Tracking
Pipeline Effect
- Retail Tracking
- Sales and Distribution
- Retail Analytics
- Category Management
- Marketing Education
- Is Marketing Education Fluffy and Weak?
- How to Choose the Right Marketing Simulator
- Self-Learners: Experiential Learning to Adapt to the New Age of Marketing
- Negotiation Skills Training for Retailers, Marketers, Trade Marketers and Category Managers
- Simulators becoming essential Training Platforms
- What they SHOULD TEACH at Business Schools
- Experiential Learning through Marketing Simulators
-
MarketingMind
Retail Tracking
Retail Tracking
The Nielsen Code
Applications of Retail Tracking
Where to Measure Sales?
Retail Measurement Services
Retail Universe
Retail Census
Sample Design — Retail Tracking
Data Collection — Retail Tracking
Data Processing — Retail Tracking
Data Projection — Retail Tracking
Analysis and Interpretation — Retail Tracking
Numeric and Weighted Distribution
In-Stock and Out-of-Stock Distribution
Coverage Analysis — Retail Tracking
Pipeline Effect
- Retail Tracking
- Sales and Distribution
- Retail Analytics
- Category Management
- Marketing Education
- Is Marketing Education Fluffy and Weak?
- How to Choose the Right Marketing Simulator
- Self-Learners: Experiential Learning to Adapt to the New Age of Marketing
- Negotiation Skills Training for Retailers, Marketers, Trade Marketers and Category Managers
- Simulators becoming essential Training Platforms
- What they SHOULD TEACH at Business Schools
- Experiential Learning through Marketing Simulators
Analysis and Interpretation — Retail Tracking
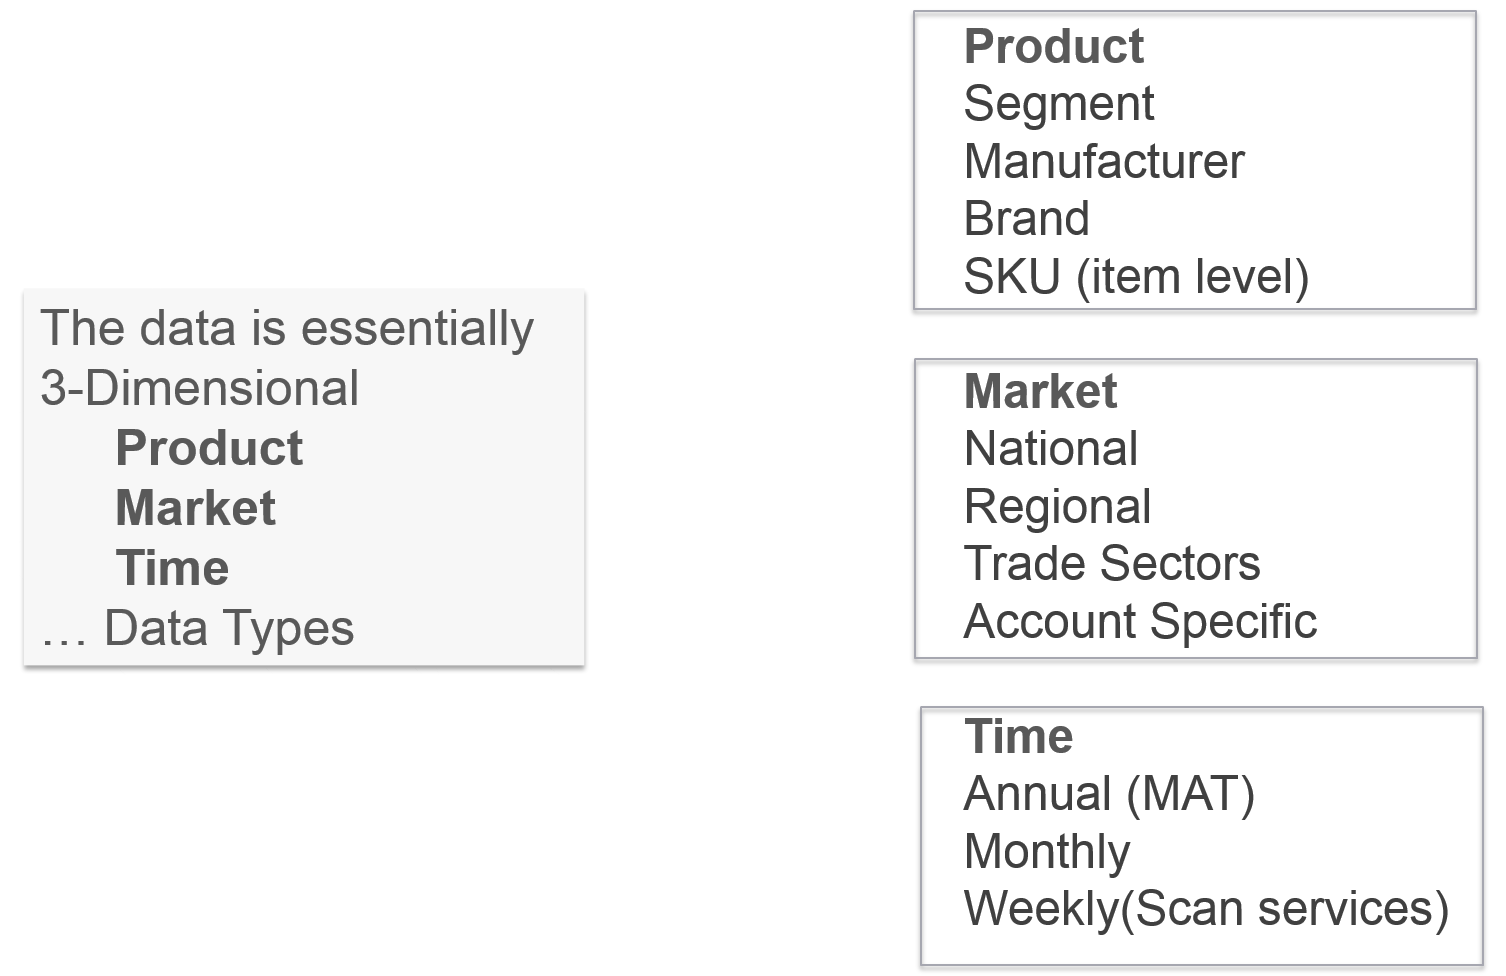
Exhibit 30.12 Retail tracking data is three dimensional. (Click to view data processing and visualization platform).
Retail tracking data encompasses three key dimensions — product, market, and time (as shown in Exhibit 30.12), each of which possesses a hierarchical structure. To illustrate, the product dimension can be further disaggregated into categories, segments, sub-segments, manufacturers, brands, variants, and individual items.
Within this comprehensive framework, several metrics and facts are supported by the retail index. Some of these include:
- Sales Volume.
- Sales Value.
- Year-to-date (YTD) Sales Volume and Value: The sum of sales volume/value from the beginning of year to the latest period.
- Moving Annual Total (MAT) Sales Volume and Value: The sum of the total sales volume/value for the 12 months ending with latest period.
- Average Price: Sales Value ÷ Sales Volume.
- Retailer Purchases Volume and Value.
- Forward Stock: Stock in the store’s selling area which can easily be accessed by customers. Includes stock placed on shelf, on special display, on the shop floor space, inside chillers, freezers, cabinets and so on.
- Total Stock: Stock in the store’s selling area plus stock in the storeroom (backroom or stock room).
- Stock Cover (Stock Cover Days):
Number of days that stock would last, assuming sales continue at the same rate.
Example: If stock is 300 units and sales is 600 units per month, then stock cover days = 300/600 = half a month. - Out of Stock: Percentage of stores in the universe that sold the product in the audit period but had no stock at the time stock was counted.
- Numeric Distribution: Percentage of stores handling product. A store is considered a product handler during an audit period, if it stocked that product at any time during that period.
- Weighted Distribution: Percentage of stores handling product weighted by product category store sales. This is equal to share of category sales by handlers.
Numeric and Weighted Distribution

Exhibit 30.13 What is the numeric and weighted distribution of brands X, Y and Z? (Universe is shops A, B, C and D).
Let’s take the example presented in Exhibit 30.13 to understand the concepts of numeric distribution and weighted distribution.
In this example, Brand X is carried by three shops (handlers): A, B and C. The numeric distribution of Brand X is calculated by dividing the number of shops carrying the brand (which is 3) by the total number of available shops (which is 4), resulting in a numeric distribution of 75% (3 out of 4).
The weighted distribution of Brand X is determined by considering the total weight of the handlers (A, B and C) in terms of category sales. In the given example, the weighted distribution of Brand X is equal to 50%. This value is derived from adding up the category sales weights of each handler (5 + 20 + 25).
A brand’s weighted distribution can be defined as the brand’s handlers’ trade share of category sales. It corresponds to the handlers’ contribution to total category sales.
Unless otherwise specified, distribution is weighted in terms of category value sales. Defined as a percentage of where money is spent on the product category, it reflects the quality of distribution.
When comparing brand X and brand Z, it can be observed that brand X has a lower weighted distribution (50%) than its numeric distribution (75%). This suggests that the quality of brand X’s distribution is relatively weak. On the other hand, brand Z has a numeric distribution of 50% and a weighted distribution of 70%, indicating that it is handled by stores that make a more significant contribution to category sales.
By analysing these metrics, marketers and researchers can gain insights into the market presence and performance of a brand, considering both the number of shops carrying the brand and the sales weight associated with those shops.
Whereas weighting of stores on category sales is the norm, for certain categories, it is advisable to assign weights based on ACV (i.e., the sales value of all categories) or based on a collection of related categories. This practice is particularly beneficial for small, new, or growing categories that have a limited number of brands. For such categories, ACV weighted distribution is a better indicator of the quality of distribution.
In-Stock and Out-of-Stock Distribution
To clarify the distinction between in-stock distribution, out-of-stock (OOS) distribution, and loss of distribution, it is essential to understand the dynamics of product availability and stock levels.
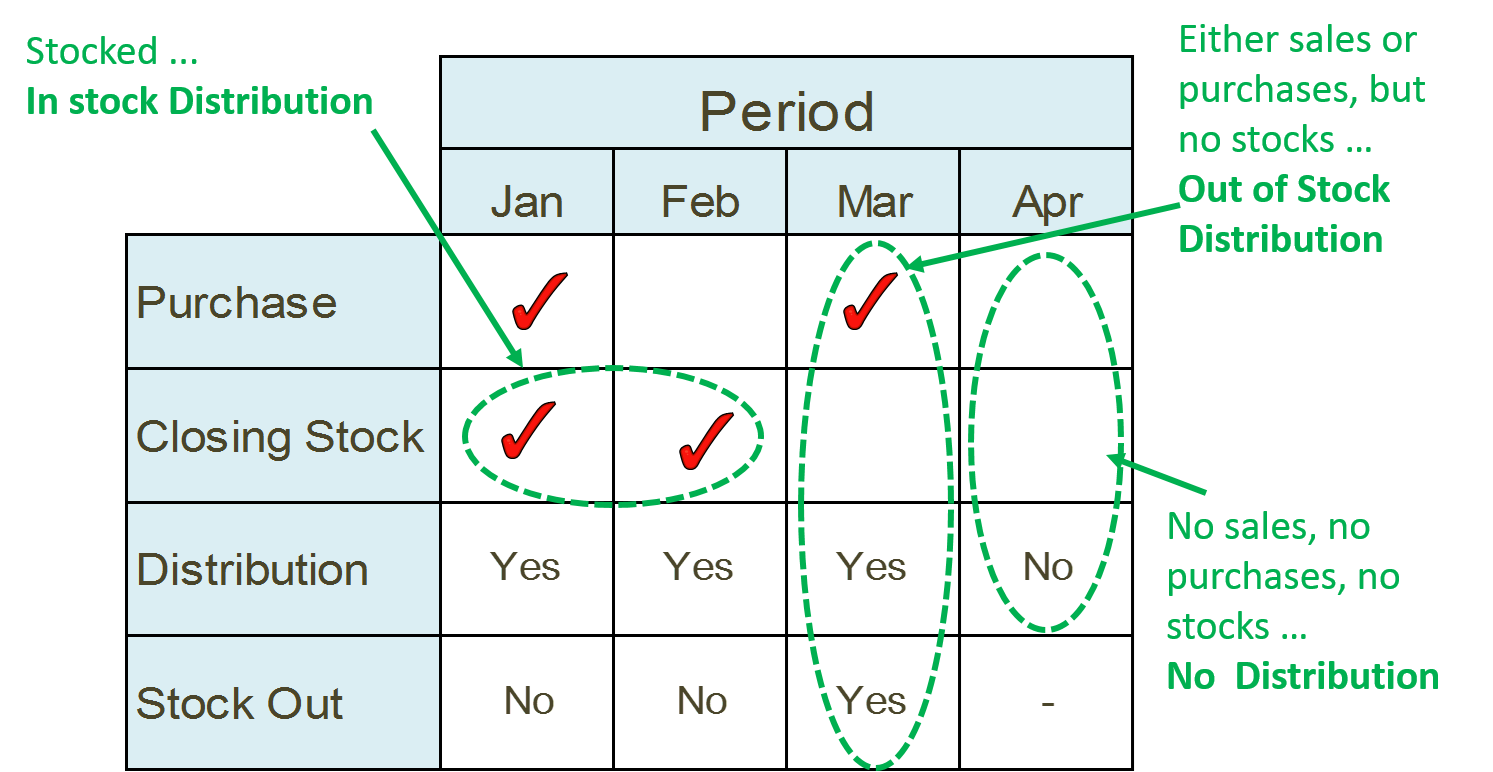
Let’s refer to Exhibit 30.14, which provides an example of a brand’s incidence of purchase and stocks across four time periods. In January and February, the brand was in-stock, meaning it was available for purchase, or more specifically there was closing stock for these months. However, in March, the brand experienced an out-of-stock (OOS) situation, indicating that it was unavailable for purchase at the time the retail auditor was checking stock. Then, in April, the brand lost distribution because there were no sales, purchases, or stocks of the product in the store. Essentially, the brand ceased to exist within the store during April.
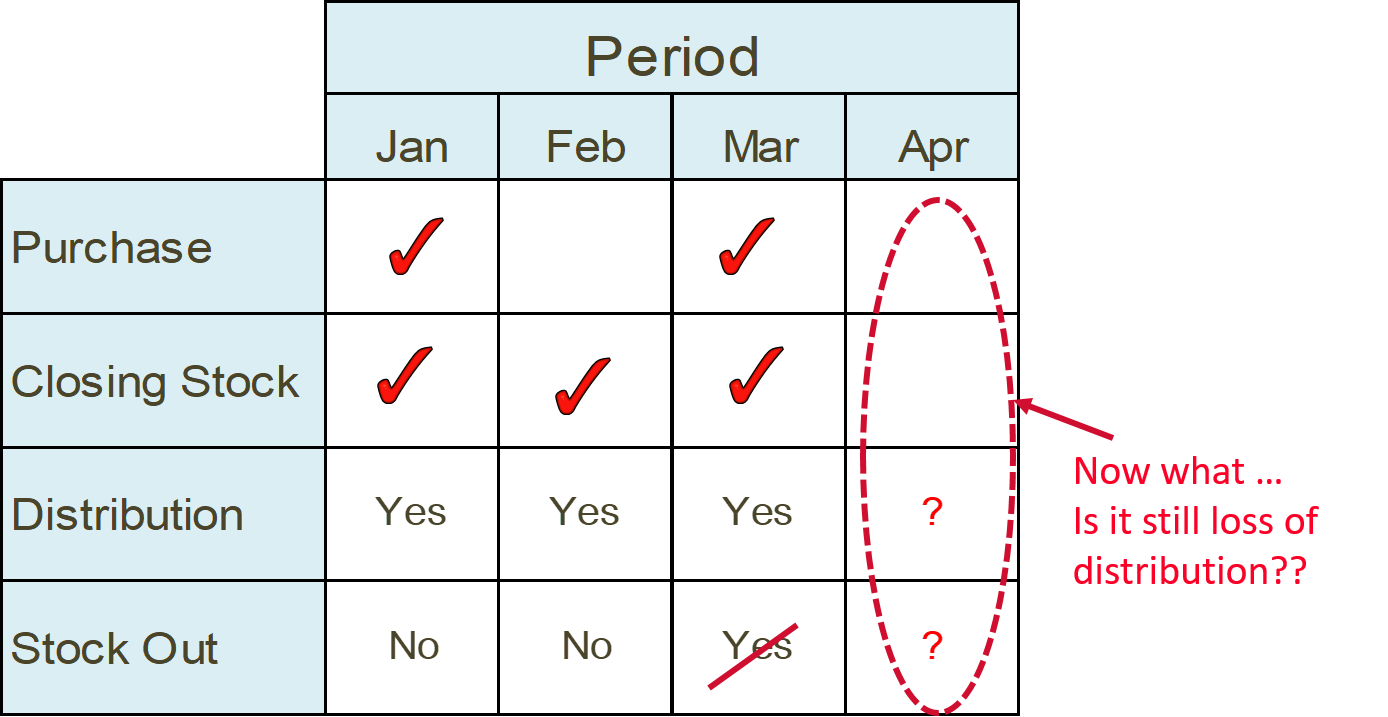
Now, let’s consider the scenario depicted in Exhibit 30.15 where there was some closing stock of the brand at the end of March. So, the status changes from out-of-stock (OOS) distribution in March to in-stock distribution. However, similar to the previous case, there were no purchases made in April, and by the end of April, there were no stocks of the brand.
So, the question arises: Is the store still considered a non-distributor in April?
The closing stocks at the end of March serve as the opening stocks for April. These stocks would have been sold during the month of April. Therefore, in this scenario, in April, the store is a product handler that experienced stockouts for the product. It can no longer be categorized as a non-distributor for the month of April.
Benefits — Market Understanding
Retail tracking captures the vital market information required for formulating marketing strategies and sales plans. Here are some key analyses that can be derived from this data:
- Market Structure: Retail tracking data on the size and growth of categories, segments, and brands, imparts an understanding of consumer trends, revealing market opportunities and threats.
- Channel Performance: The data helps in assessing the size, growth, and development of channels and retail chains, which is essential for formulating effective channel strategies.
- Brand Health: Key metrics such as brand growth, market share, distribution, and pricing are tracked by retail tracking services. These metrics provide insights into the overall health and performance of a brand.
- Competition: The data reveals the activities of competitors, allowing for a deeper understanding of their strengths and weaknesses. This information is valuable for competitive analysis and benchmarking.
- Sales Evaluation: Retail tracking metrics like distribution, stock levels, stock cover, and out-of-stock (OOS) incidents are vital for sales evaluation and distribution diagnostics, enabling businesses to identify areas of improvement and optimize their sales strategies.
The analysis and interpretation of retail tracking data, particularly in the context of sales and distribution, are further explored in Chapter 30, Sales and Distribution. The chapter delves into the methods of analysing and leveraging the data to enhance sales performance and strengthen distribution strategies.
Previous Next
Use the Search Bar to find content on MarketingMind.
Business Intelligence - Market and Trade
Suite of interactive, online dashboards that seamlessly integrate retail and consumer data sources in a manner that makes it easier to glean insights.
Scan Track
Suite of dashboards to visualize/analyse retail scan data.
Online Apps to train Category Managers
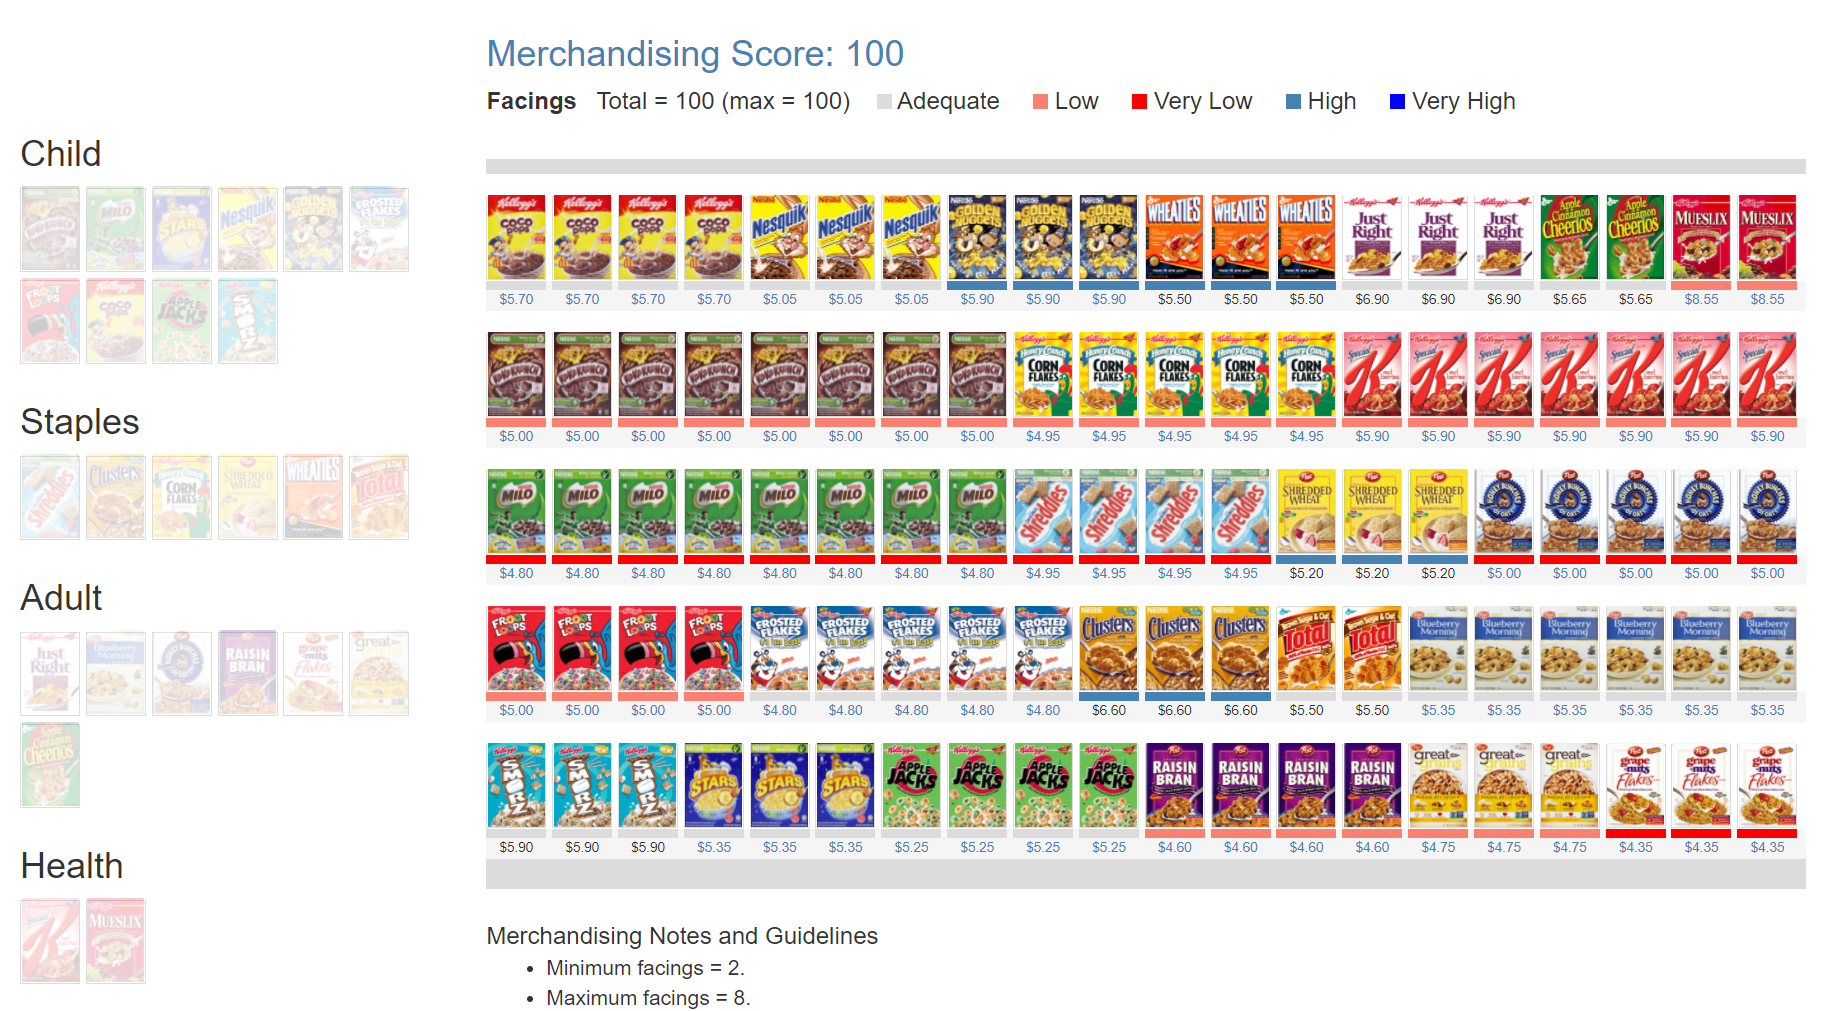
The Plannogrammer is an experiential learning facility for category managers, trade marketers, and retailers in consumer markets. Ideally suited for hybrid learning programmes, Plannogrammer imparts hands-on training in the planning and evaluation of promotions and merchandising.
It supports a collection of simulation and analysis platforms such as Promotions and Space Planner for optimizing space and promotions, Plannogram for populating shelves and merchandising, a Due To Analysis dashboard that decomposes brand sales into the factors driving sales, and a Promotion Evaluator to evaluate the volume, value and profit impact of promotion plans.


Contact | Privacy Statement | Disclaimer: Opinions and views expressed on www.ashokcharan.com are the author’s personal views, and do not represent the official views of the National University of Singapore (NUS) or the NUS Business School | © Copyright 2013-2026 www.ashokcharan.com. All Rights Reserved.