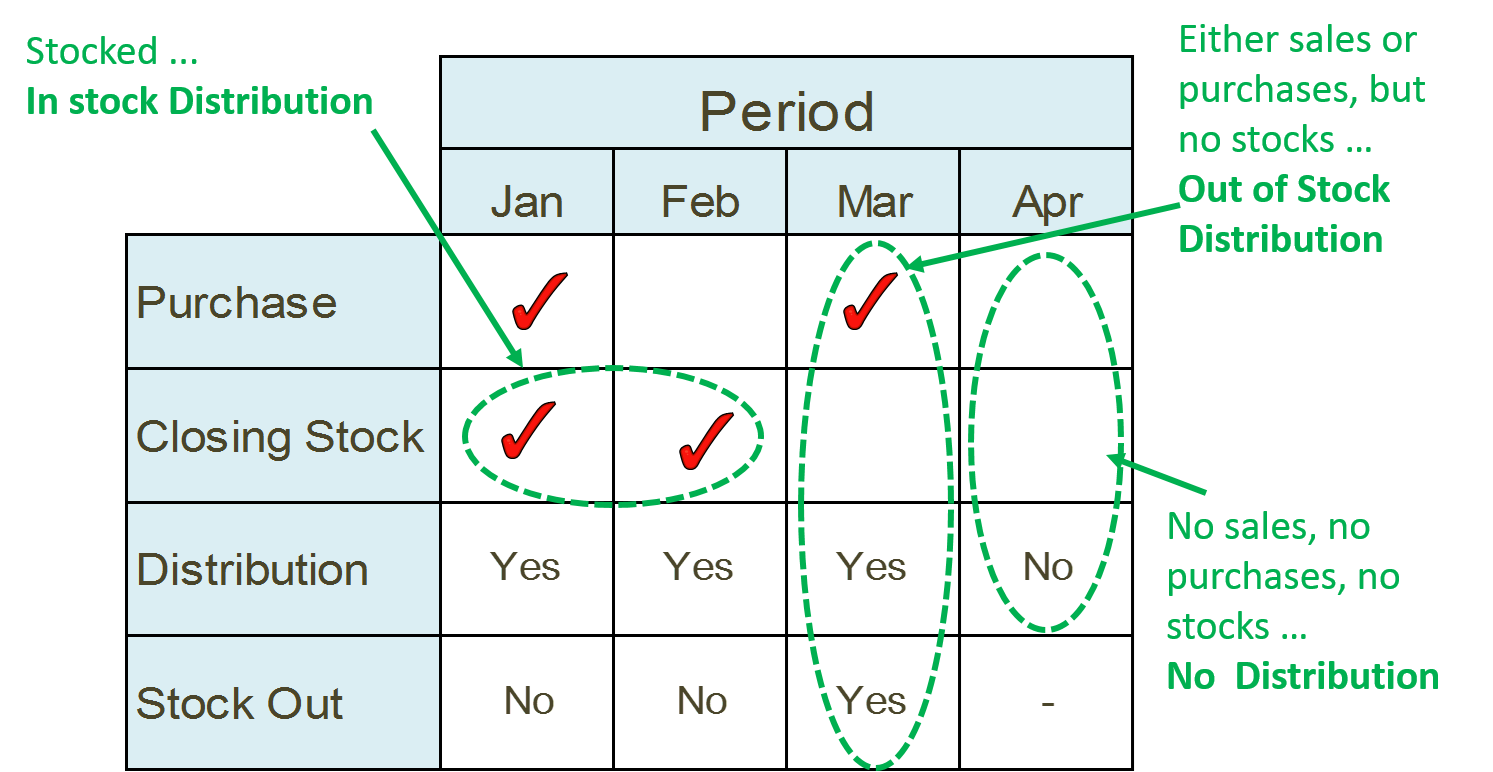
Exhibit 30.14 Stockout and loss of distribution.
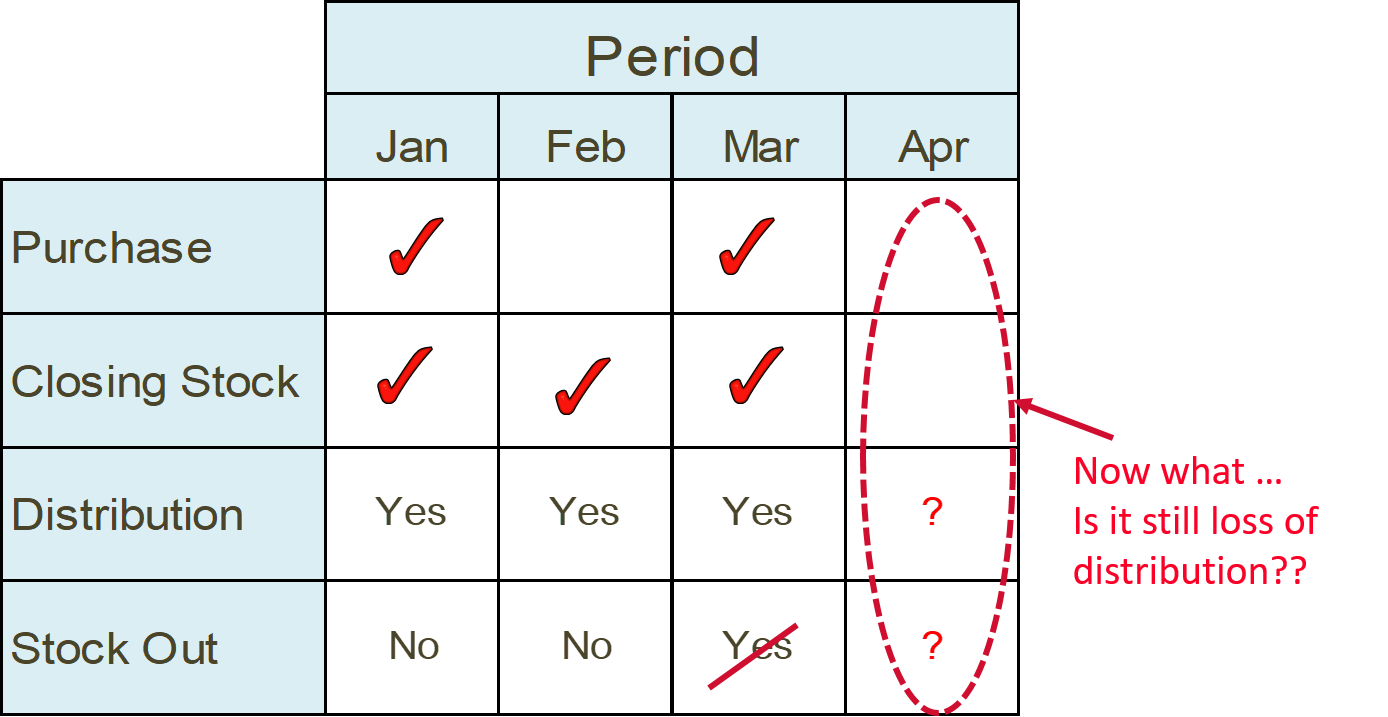
Exhibit 30.15 Stockout and loss of distribution.
Distribution, the metric commonly
used for tracking product availability, is usually measured in numeric and weighted terms.
It may be weighted in either volume or value.
Numeric Distribution
is the percentage of stores handling product.
Weighted Distribution
is the percentage of stores handling product weighted by product category store sales.
If the weight is in value terms, which usually is the norm, then weighted
distribution is the same as the value share of category sales by handlers.
To clarify the distinction between in-stock distribution, out-of-stock (OOS)
distribution, and loss of distribution, it is essential to understand the dynamics of product
availability and stock levels.
Let’s refer to Exhibit 30.14, which provides
an example of a brand’s incidence of purchase and stocks across four time periods. In January
and February, the brand was in-stock, meaning it was available for purchase, or more
specifically there was closing stock for these months. However, in March, the brand experienced
an out-of-stock (OOS) situation, indicating that it was unavailable for purchase at the time the
retail auditor was checking stock. Then, in April, the brand lost distribution because there
were no sales, purchases, or stocks of the product in the store. Essentially, the brand ceased
to exist within the store during April.
Now, let’s consider the scenario depicted in Exhibit
30.15 where there was some closing stock of the brand at the end of March. So, the
status changes from out-of-stock (OOS) distribution in March to in-stock distribution. However,
similar to the previous case, there were no purchases made in April, and by the end of April,
there were no stocks of the brand.
So, the question arises: Is the store still considered a non-distributor in April?
The closing stocks at the end of March serve as the opening stocks for April. These
stocks would have been sold during the month of April. Therefore, in this scenario, in April, the
store is a product handler that experienced stockouts for the product. It can no longer be
categorized as a non-distributor for the month of April.