
-
Consumer Panels & Consumer Analytics
Consumer Panels & Consumer Analytics
Research Methodology
Width and Depth of Purchase
Buyer Groups
Profile Analysis
Brand Loyalty (Behavioural)
Trial and Repeat
Purchase Frequency
Repeat Decay Curve
Overlap
Basket
Gain-loss
Example — Johnson’s Body Care
- Segmentation
- Qualitative Research
- Quantitative Research
- Customer Satisfaction and Customer Value
- Consumer Panels and Consumer Analytics
- Big Data and Consumer Analytics
- Marketing Education
- How to Choose the Right Marketing Simulator
- Self-Learners: Experiential Learning to Adapt to the New Age of Marketing
- Negotiation Skills Training for Retailers, Marketers, Trade Marketers and Category Managers
- Simulators becoming essential Training Platforms
- What they SHOULD TEACH at Business Schools
- Experiential Learning through Marketing Simulators
-
MarketingMind
Consumer Panels & Consumer Analytics
Consumer Panels & Consumer Analytics
Research Methodology
Width and Depth of Purchase
Buyer Groups
Profile Analysis
Brand Loyalty (Behavioural)
Trial and Repeat
Purchase Frequency
Repeat Decay Curve
Overlap
Basket
Gain-loss
Example — Johnson’s Body Care
- Segmentation
- Qualitative Research
- Quantitative Research
- Customer Satisfaction and Customer Value
- Consumer Panels and Consumer Analytics
- Big Data and Consumer Analytics
- Marketing Education
- How to Choose the Right Marketing Simulator
- Self-Learners: Experiential Learning to Adapt to the New Age of Marketing
- Negotiation Skills Training for Retailers, Marketers, Trade Marketers and Category Managers
- Simulators becoming essential Training Platforms
- What they SHOULD TEACH at Business Schools
- Experiential Learning through Marketing Simulators
Case Example — Johnson’s Body Care
Johnson’s, a brand that cuts across multiple categories, is a leading brand in hand & body (H&B) lotion and body wash — two categories where market dynamics differs greatly. H&B lotion is a small relatively quiet market where Johnson’s often maintains a dominant leadership position. Body wash on the other hand is a cutthroat business with thin margins, as big global brands jostle for market share.
Some years back Johnson’s regional leadership was exploring ways to exploit the synergy of the brand across the two categories. They had a few questions on their minds — Could Johnson’s equity transcend categories? Could they leverage the brand’s equity from one category to another? If so, that would open opportunities to strengthen the brand as well as optimize costs in brand building.
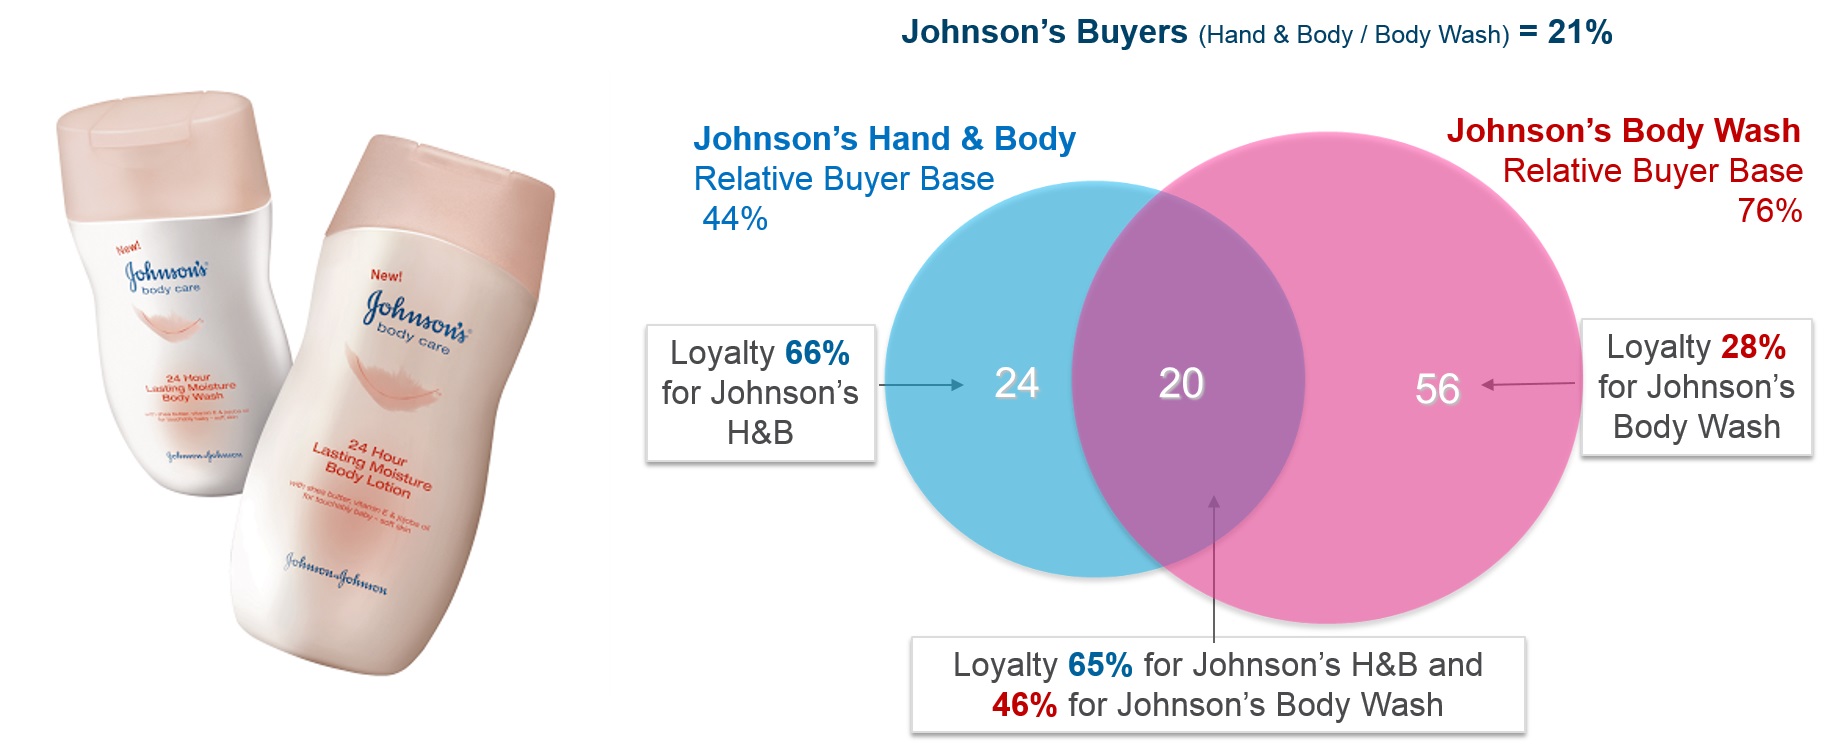
At Nielsen, we picked the Singapore market for in-depth study of the Johnson’s brand. One analysis, depicted in Exhibit 7.22, provides a break-up of the 21% Johnson’s buyers into three buyers groups — those who bought Johnson’s H&B only (H&B only — 24% of buyers), those who bought Johnson’s Body Wash only (BW only — 56% of buyers) and those who bought both Johnson’s H&B and Johnson’s Body Wash (H&B + BW — 20% of buyers). For each of the three buyer groups, we examined their behavioural loyalty to the Johnson’s brand within H&B and body wash.
Considering Johnson’s dominant position in H&B, it did not come as a surprise that loyalty for Johnson’s H&B was high (65-66%) for both H&B only and H&B + BW buyer groups. What caught our attention, however, was the much higher loyalty of 46% for Johnson’s Body Wash, among H&B + BW buyers, compared to the 28% loyalty, among BW only buyers.
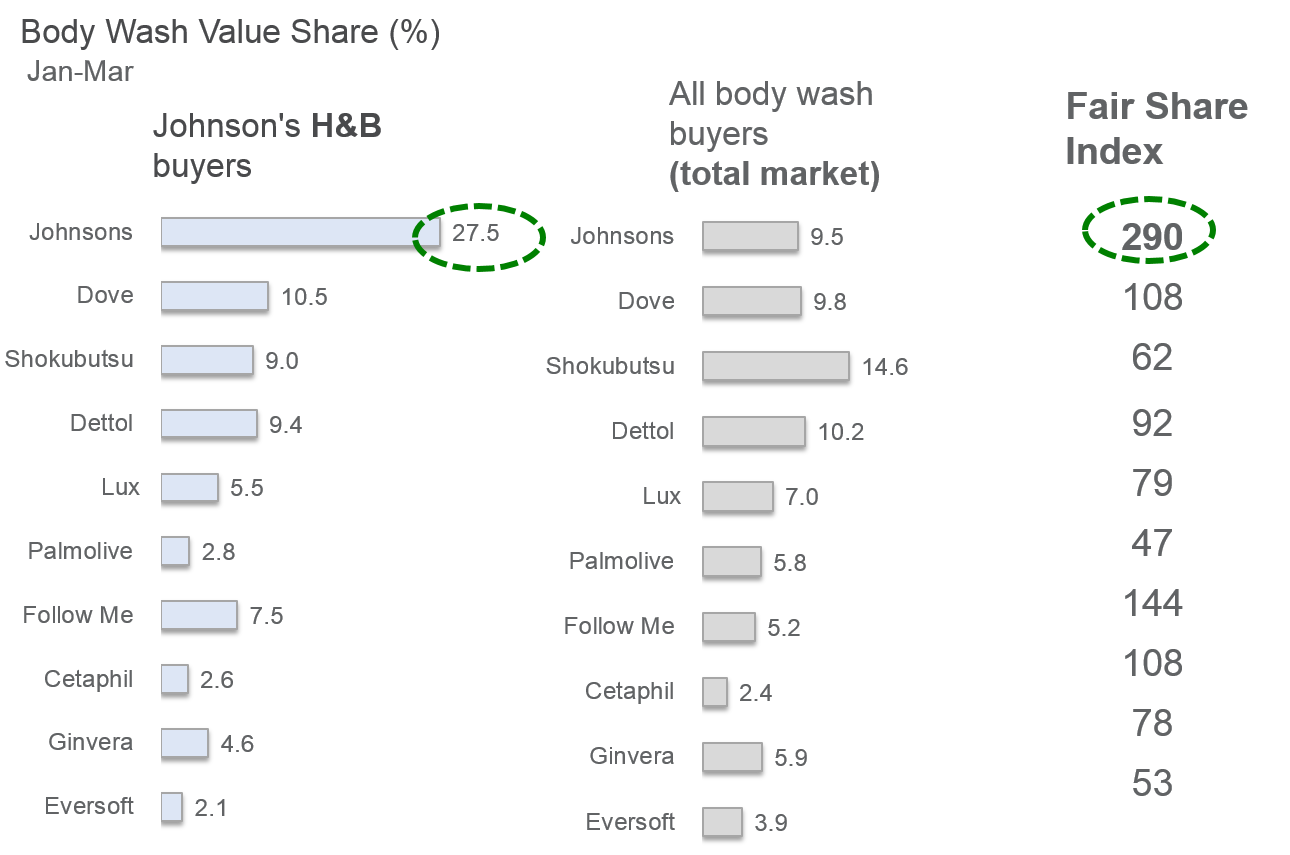
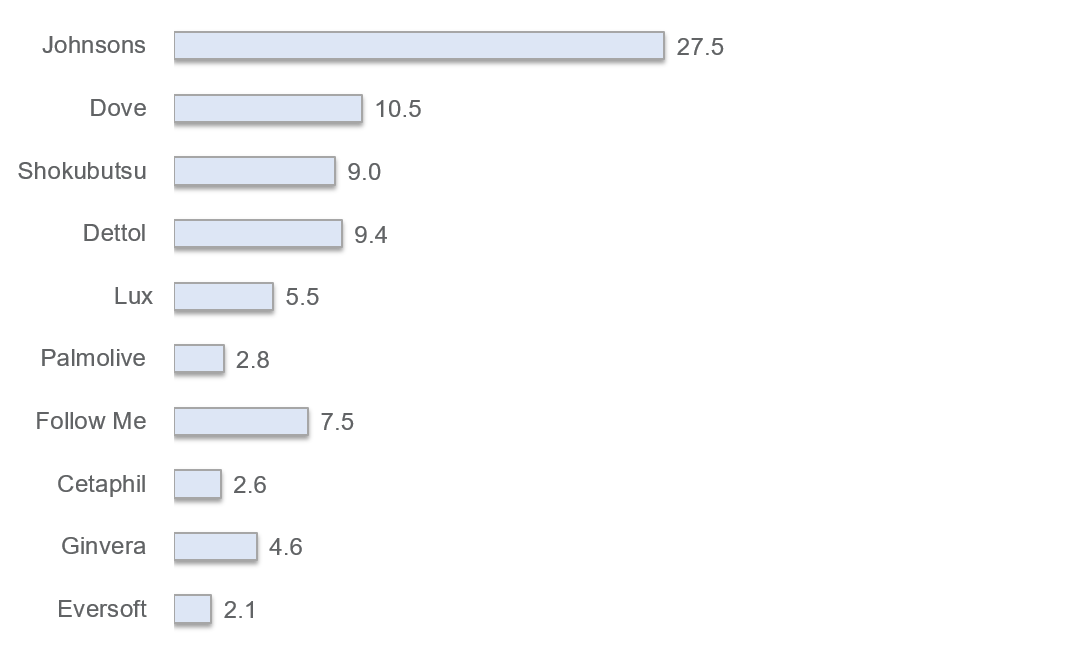
Also revealing was the cross-basket analysis of Johnson’s H&B buyers. Exhibit 7.23 depicts the body wash basket of purchases by the Johnson’s H&B buyers’ buyer group. Within this group, Johnson’s Body Wash had a commanding share of 27.5% — which is exceptionally high when compared with the 9.5% market share of Johnson’s Body Wash, within the panel population as a whole.
In the context of buyer groups, the share of Johnson’s Body Wash in total market (9.5%) is called the “fair share” — i.e., the share we would expect if there was nothing extraordinary about the buyer group. The index 27.5/9.5 (= 290 re-based to 100), called the fair share index, is extraordinarily high. It tells us that the propensity of a Johnson’s H&B buyer to buy (in terms of value) Johnson’s Body Wash, is 2.9 times greater than that for the average brand buyer.
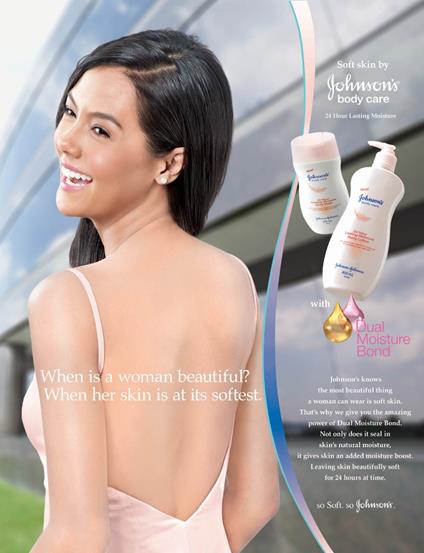
The cross-category overlap analysis, and the cross-basket analysis suggested that Johnson’s brand equity transcended the categories; that there existed a strong synergistic relationship. Consumers buying both Johnson’s product were much more loyal to Johnson’s Body Wash. This synergy was leveraged via subsequent marketing efforts such as the joint Johnson’s body care ad in Exhibit 7.21, which jointly advertised Johnson’s Body Wash and Johnson’s H&B lotion.
Previous
Use the Search Bar to find content on MarketingMind.
Marketing Analytics Workshop
In an analytics-driven business environment, this analytics-centred consumer marketing workshop is tailored to the needs of consumer analysts, marketing researchers, brand managers, category managers and seasoned marketing and retailing professionals.
Digital Marketing Workshop

Unlock the Power of Digital Marketing: Join us for an immersive online experience designed to empower you with the skills and knowledge needed to excel in the dynamic world of digital marketing. In just three days, you will transform into a proficient digital marketer, equipped to craft and implement successful online strategies.
Cross Basket Analysis Demo
Demo of Cross Basket analysis on the Destiny analytics platform.


Contact | Privacy Statement | Disclaimer: Opinions and views expressed on www.ashokcharan.com are the author’s personal views, and do not represent the official views of the National University of Singapore (NUS) or the NUS Business School | © Copyright 2013-2024 www.ashokcharan.com. All Rights Reserved.