
-
Consumer Panels & Consumer Analytics
Consumer Panels & Consumer Analytics
Research Methodology
Width and Depth of Purchase
Buyer Groups
Profile Analysis
Brand Loyalty (Behavioural)
Trial and Repeat
Purchase Frequency
Repeat Decay Curve
Overlap
Basket
Gain-loss
Example — Johnson’s Body Care
- Segmentation
- Qualitative Research
- Quantitative Research
- Customer Satisfaction and Customer Value
- Consumer Panels and Consumer Analytics
- Big Data and Consumer Analytics
- Marketing Education
- Is Marketing Education Fluffy and Weak?
- How to Choose the Right Marketing Simulator
- Self-Learners: Experiential Learning to Adapt to the New Age of Marketing
- Negotiation Skills Training for Retailers, Marketers, Trade Marketers and Category Managers
- Simulators becoming essential Training Platforms
- What they SHOULD TEACH at Business Schools
- Experiential Learning through Marketing Simulators
-
MarketingMind
Consumer Panels & Consumer Analytics
Consumer Panels & Consumer Analytics
Research Methodology
Width and Depth of Purchase
Buyer Groups
Profile Analysis
Brand Loyalty (Behavioural)
Trial and Repeat
Purchase Frequency
Repeat Decay Curve
Overlap
Basket
Gain-loss
Example — Johnson’s Body Care
- Segmentation
- Qualitative Research
- Quantitative Research
- Customer Satisfaction and Customer Value
- Consumer Panels and Consumer Analytics
- Big Data and Consumer Analytics
- Marketing Education
- Is Marketing Education Fluffy and Weak?
- How to Choose the Right Marketing Simulator
- Self-Learners: Experiential Learning to Adapt to the New Age of Marketing
- Negotiation Skills Training for Retailers, Marketers, Trade Marketers and Category Managers
- Simulators becoming essential Training Platforms
- What they SHOULD TEACH at Business Schools
- Experiential Learning through Marketing Simulators
Consumer Panels — Trial and Repeat Purchase
The success of a new product launch hinges on two factors — its appeal and its adoption.
Appeal
New products generate appeal or desire amongst prospects, to experience the product. This is a function of the product concept and the manner in which it is communicated through product, packaging, display and advertising. Appeal translates into trial. The broader the appeal, the greater the incidence of trial of a new product.
Adoption
Adoption is the willingness to continue buying, after experiencing the new brand. It is a function of the extent to which the new product lives up to consumer’s expectations. Adoption translates into repeat purchase; the higher the level of adoption the greater the extent to which the new product gets channelled into the consumer’s repertoire of purchases.
Trial and repeat purchase are the key metrics we need to monitor to assess a new FMCG product’s market potential. For the product to succeed, it needs to establish a base of regular consumers who continue to buy it. It must generate appeal so that a substantial number of consumers try it. Once they experience it, an adequate number of them should be willing to continue buying it.
Trial
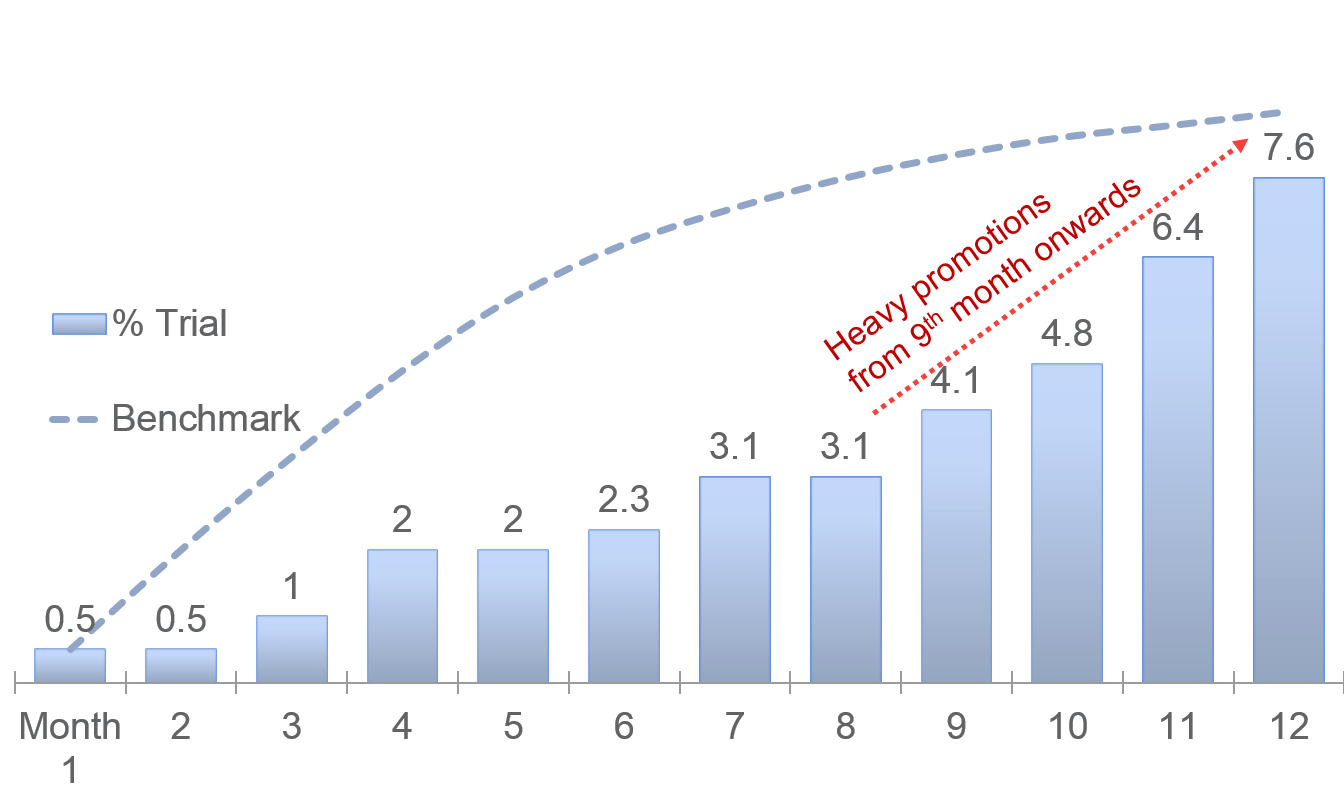
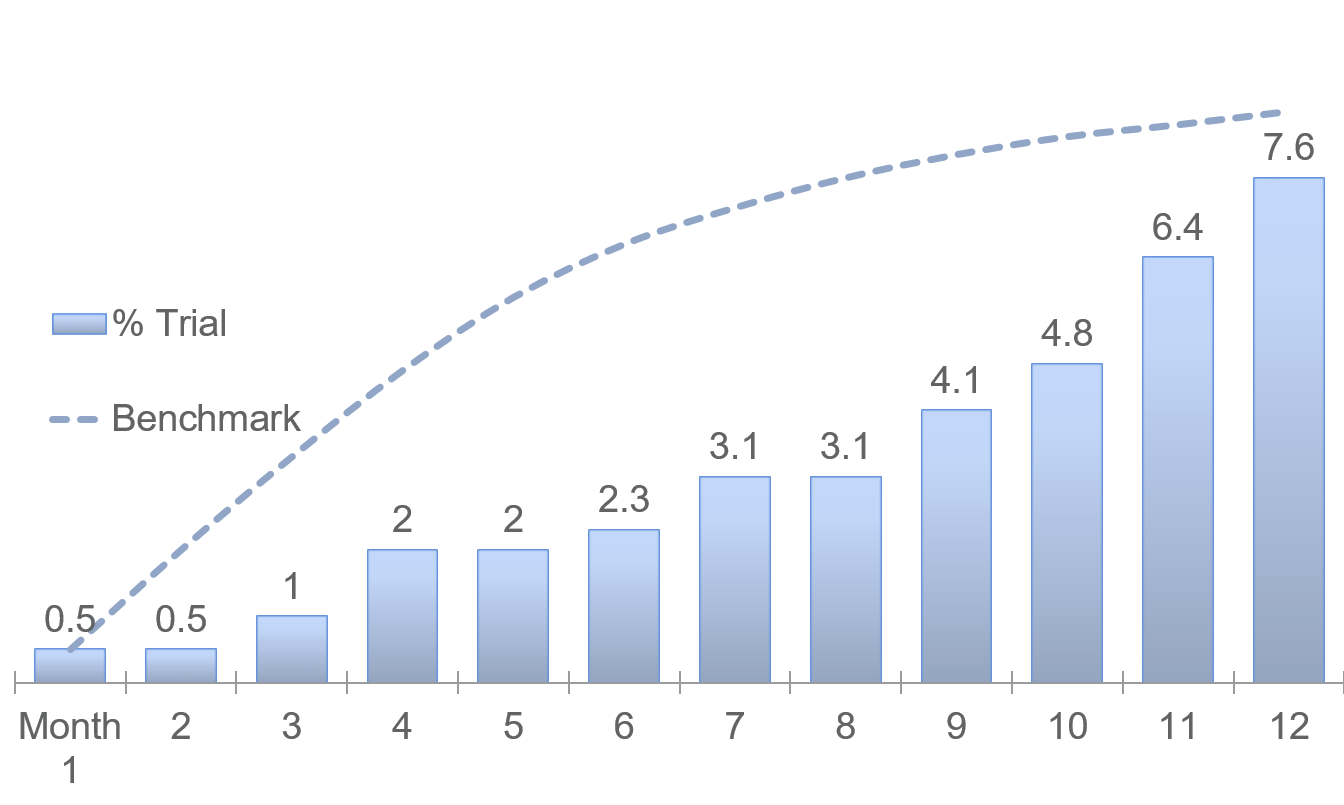
Trial or cumulative penetration at a time t is the percentage of households or individuals who purchased the product from the time it was launched till time t. (Refer example in Exhibit 7.11).
The build-up of trial for the new body wash brand shown in Exhibit 7.11 differs significantly from the benchmark. Usually, heavy promotions are scheduled during the early launch phase, but for this brand the promos kicked in more than 6 months post-launch.
Repeat Purchase
%Repeat Purchase is the proportion of buyers who bought more than once. A variation of %Repeat Purchase is the 1+, 2+, 3+ %Repeat Buyer, where the 1+ Repeaters are those who bought the product at least once, 2+ at least twice and so on.
Purchase Frequency

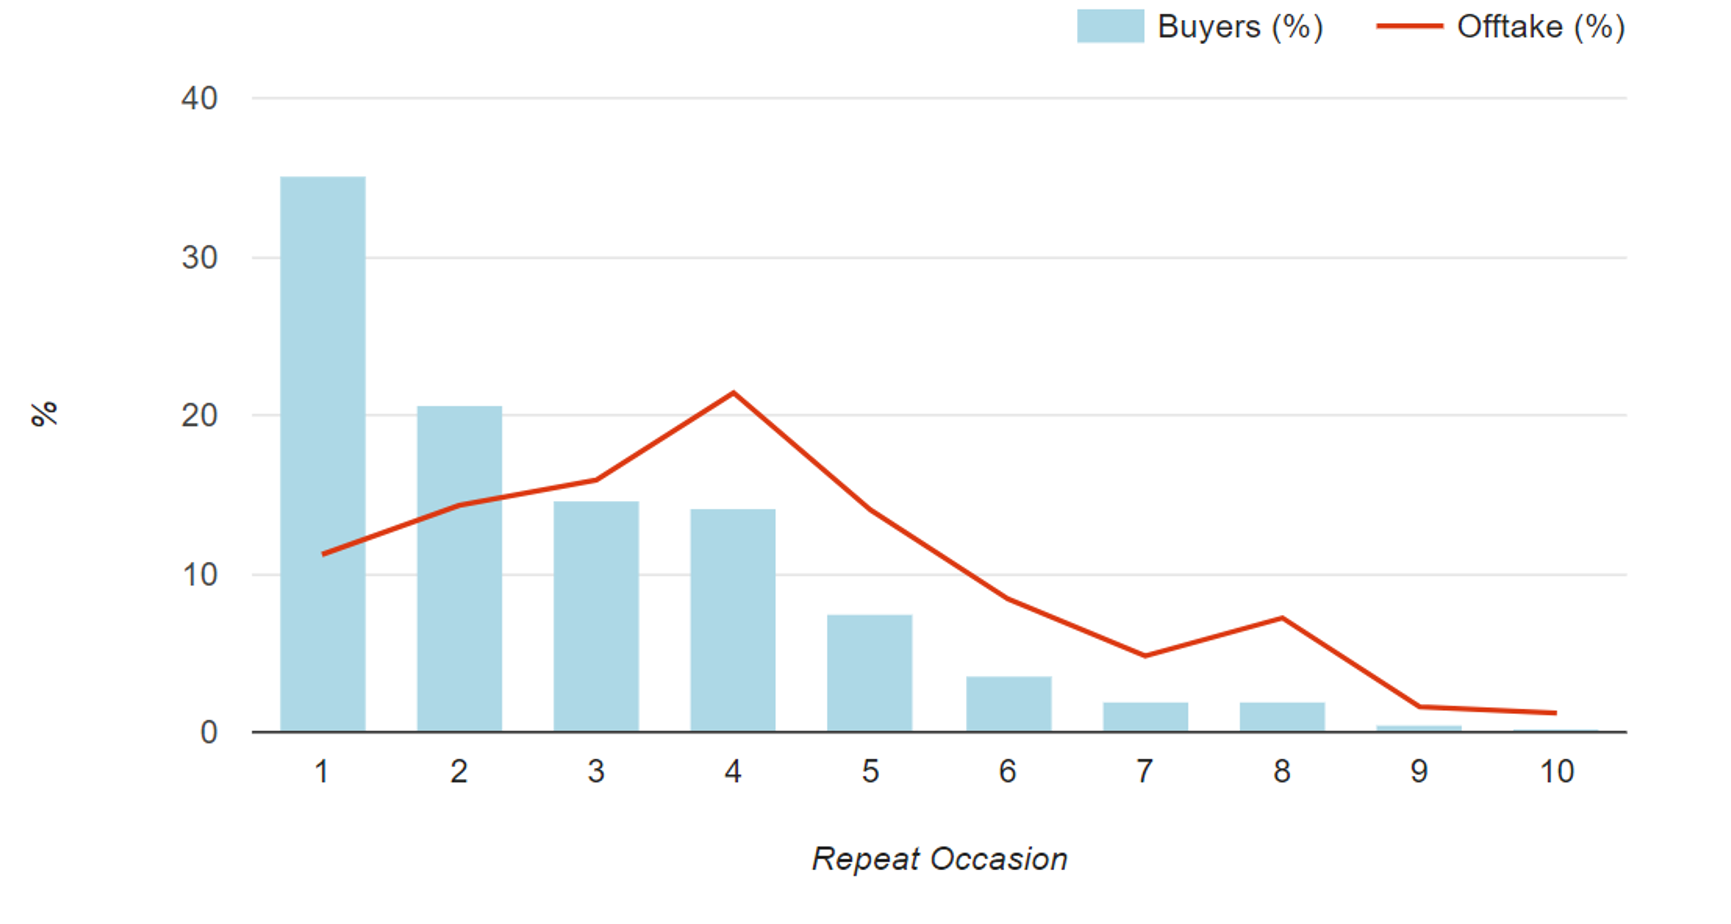
Exhibit 7.12 Purchase Frequency analysis reveals the distribution of buyers and volume across months, over a time horizon such as a year.
For fast moving products, where repeat purchase is the norm, the analysis of purchase frequency (Exhibit 7.12) is an important indicator of brand health.
Typically, this reveals the distribution of brand buyers and brand volume, across the number of purchase occasions (usually months or weeks), over a time horizon such as a year. Weaker brands have a high proportion of buyers who buy the product across only one or two months of the year. Stronger brands on the other hand, have greater proportion of consumers who buy more frequently.
Repeat Decay Curve
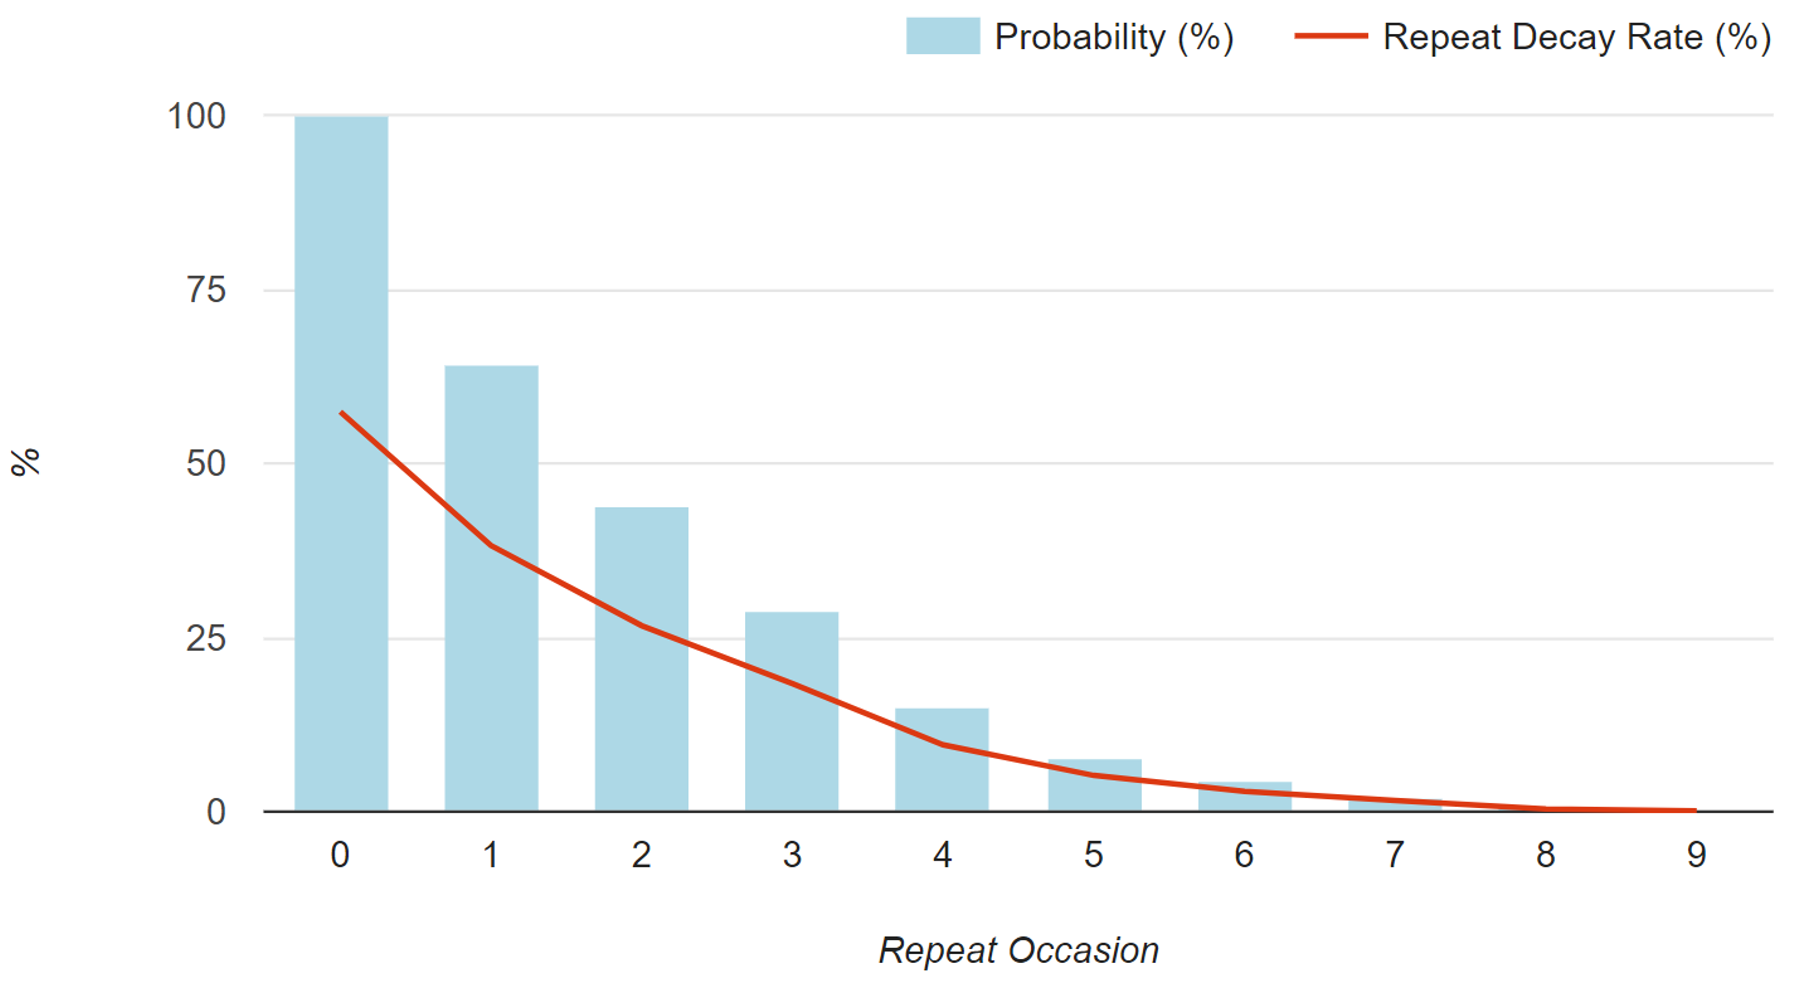
Exhibit 7.13 Repeat decay analysis depicts the proportion (probability %) of buyers who repeat purchased at least once, twice, thrice and so on, and their repeat decay rate.
The repeat decay analysis in Exhibit 7.13 depicts the proportion (probability) of buyers who repeat purchased at least once, twice, thrice and so on, and their repeat decay rate.
Computed as proportion who repeat purchased (probability) × brand loyalty, the repeat decay represents declining sales contribution across repeat occasions, over a time horizon.
Comparing repeat decay curves over different time horizons, and across brands, imparts an understanding of brand health. Brands that command greater loyalty decay at a slower pace, across repeat occasions.
Trial and repeat purchase is re-visited in the Product Validation chapter which introduces the TRB model for forecasting sales of new products, and provides an understanding of a number of concepts and metrics that relate to the evaluation of new products.
Previous Next
Use the Search Bar to find content on MarketingMind.
%Trial (Penetration) Analysis Demo
Demo of %Trial (Penetration) analysis on the Destiny analytics platform.
Purchase Frequency Analysis Demo
Demo of Purchase Repeat Frequency analysis on the Destiny analytics platform.
Repeat Decay Curve - Demo

Demo of Repeat Decay analysis on the Destiny analytics platform.


Contact | Privacy Statement | Disclaimer: Opinions and views expressed on www.ashokcharan.com are the author’s personal views, and do not represent the official views of the National University of Singapore (NUS) or the NUS Business School | © Copyright 2013-2026 www.ashokcharan.com. All Rights Reserved.