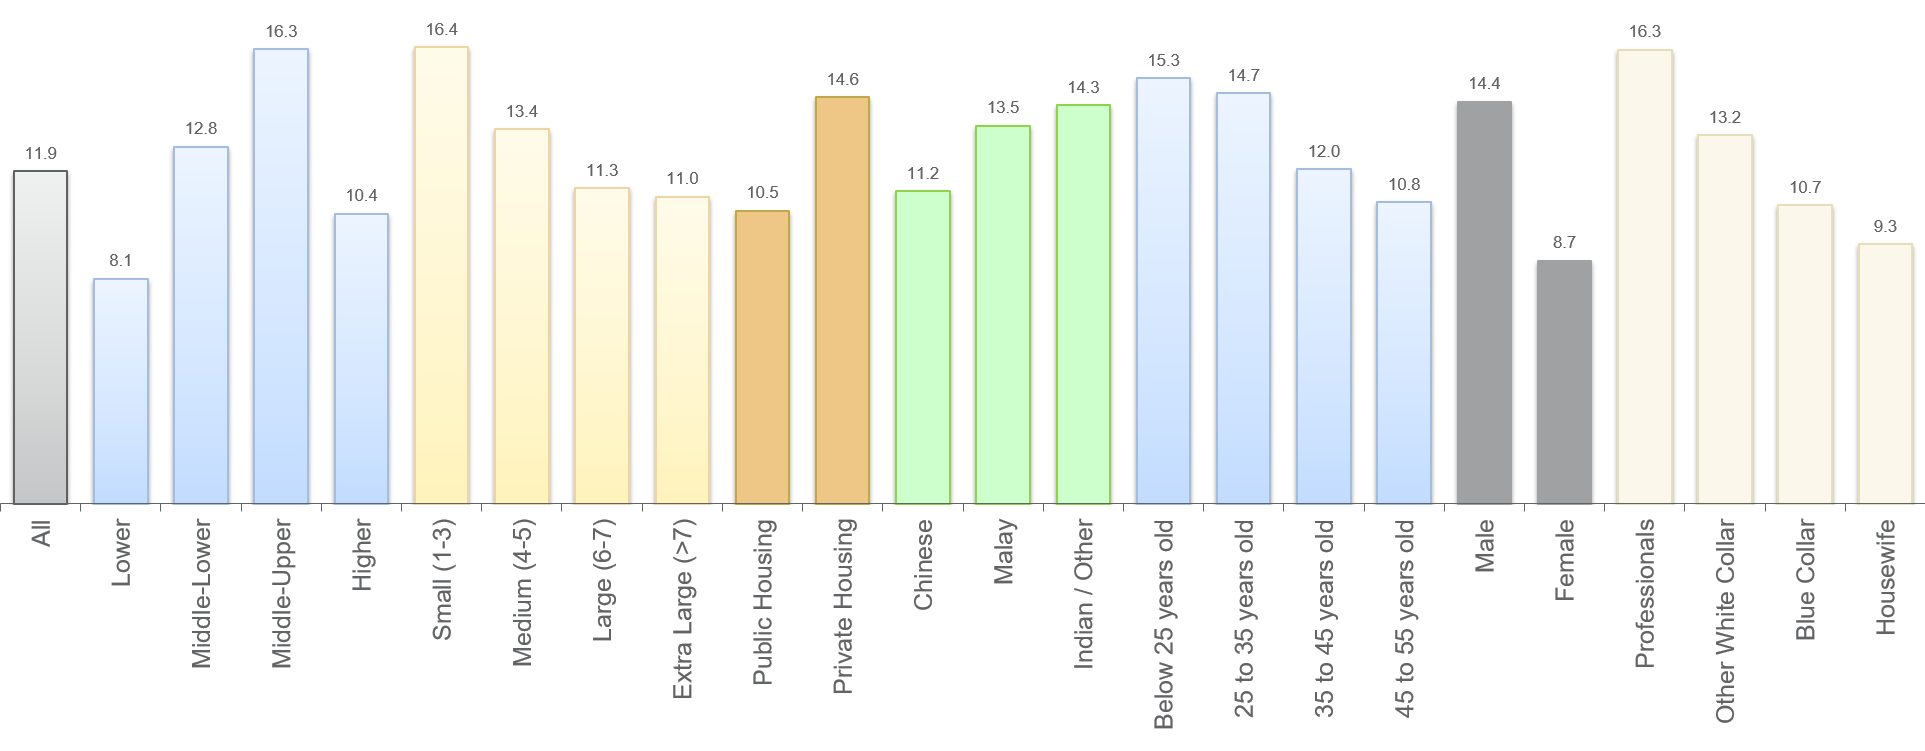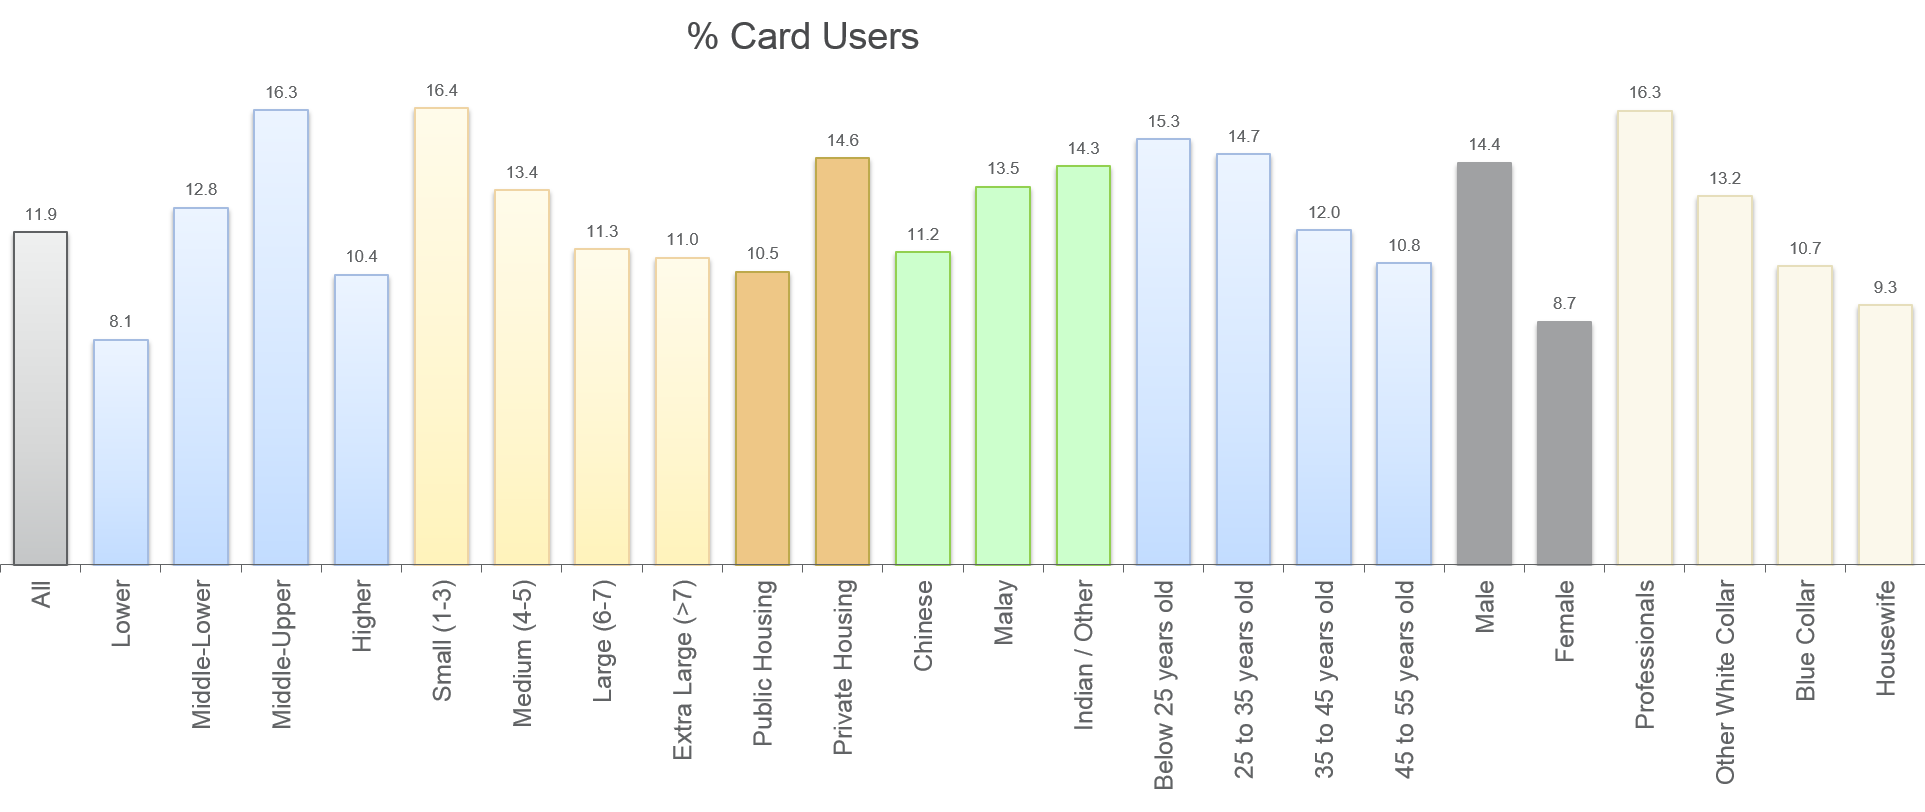
Exhibit 7.8 Demographic profile of users of a specific credit card.
(Click to view demo).
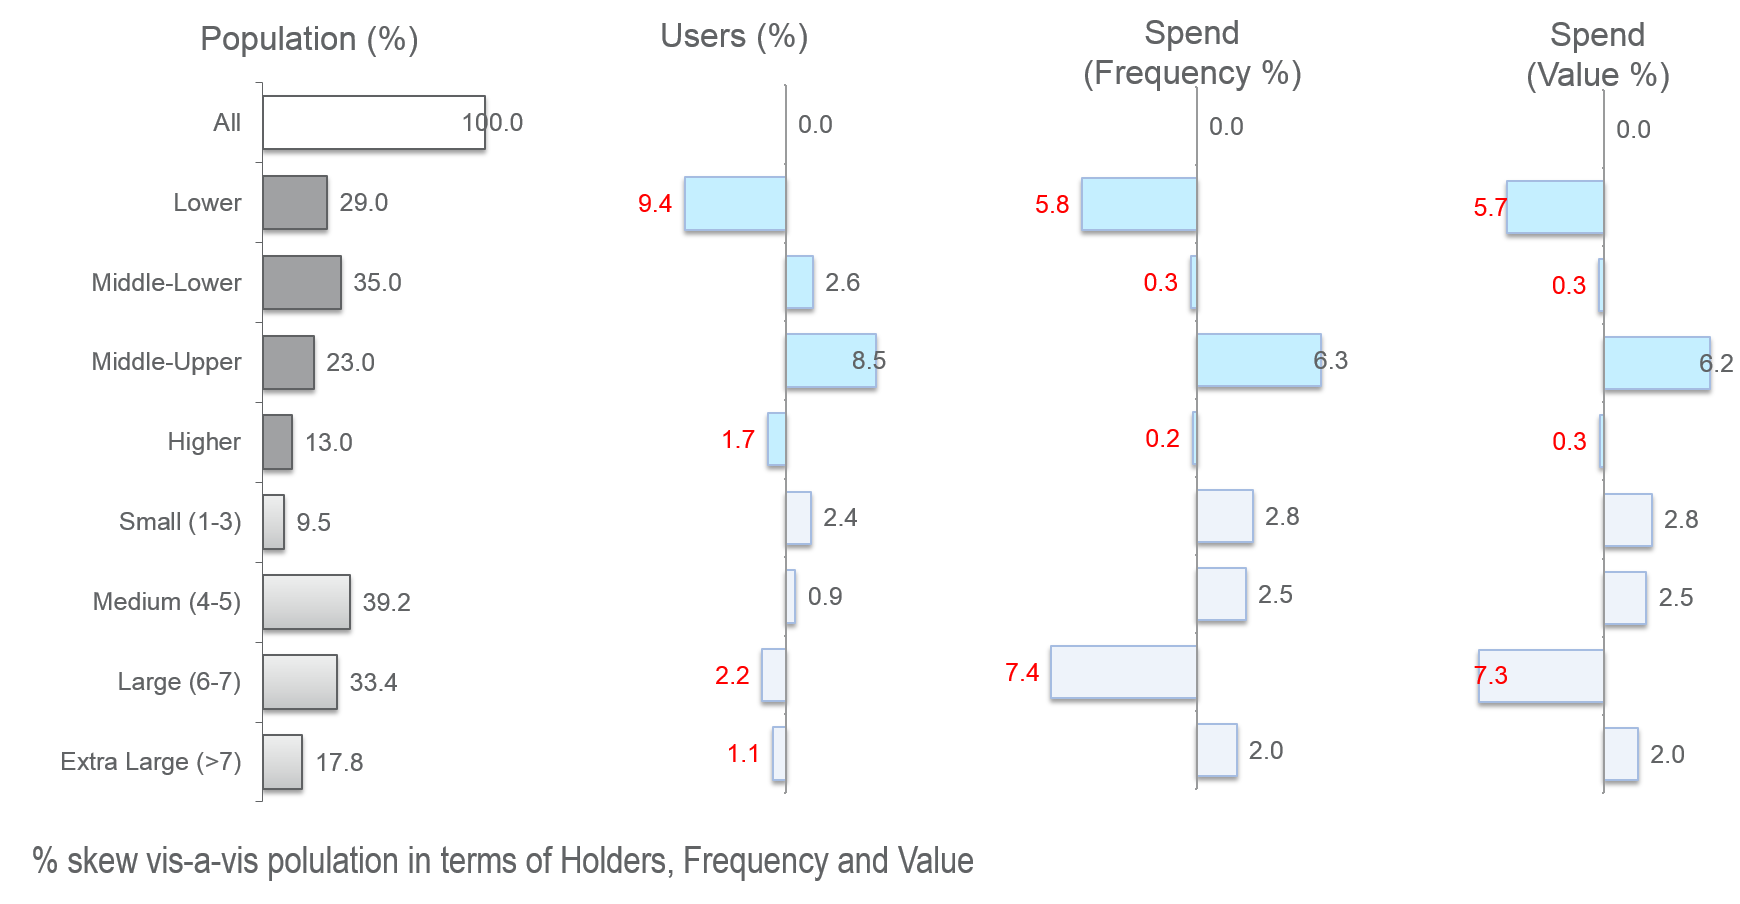
Exhibit 7.9 Skew analysis — users of the credit card.
The profile analysis
reveals a product’s buyer profile in terms of segment or demographic groups. It
can be conducted for a brand, category, segment, or a combination of items of
interest.
The analysis basically answers the following
questions:
- Who buys? — % buyers (or % users) across groups.
- How much do they buy/spend? — volume/value per buyer across
groups.
- Who contributes to the brand’s volume/value? — distribution of
volume/spend.
The demographic profile of holders of a particular
credit card is depicted, in terms of % card users, in Exhibit 7.8.
The skew analysis for the same data is provided in
Exhibit 7.9. This chart gives us the break-up of the credit card users across
income levels and across household size. The bar chart on the left tells us the
population break-up for this market across income levels: lower income — 29%,
middle-lower — 35%, middle-upper — 23% and higher income — 13%. The other
charts tell us that the profile of this card’s users has a positive skew on middle-upper
income and a negative skew on lower income. If there was no skew at all, the
break-up of users (%) and spend (%) would be exactly the same as the population
break-up. However, since there is a -9.4 point skew on lower income, the card’s
proportion of users in lower income is 29 − 9.4 = 19.6%. Similarly, the proportion
of users is 37.6% (35 + 2.6) middle-lower income, 31.5% (23 + 8.5) middle-upper
and 11.3% (13 − 1.7) higher income.
Profile analysis provides an understanding of which
buyer groups (demographic groups, consumer segments) have greater propensity to
purchase the brand (or any group of products of interest). The skew analysis
best illustrates the areas of strengths and weaknesses. This information can be
used for targeting particular buyer groups through product development,
advertising, promotions and distribution.