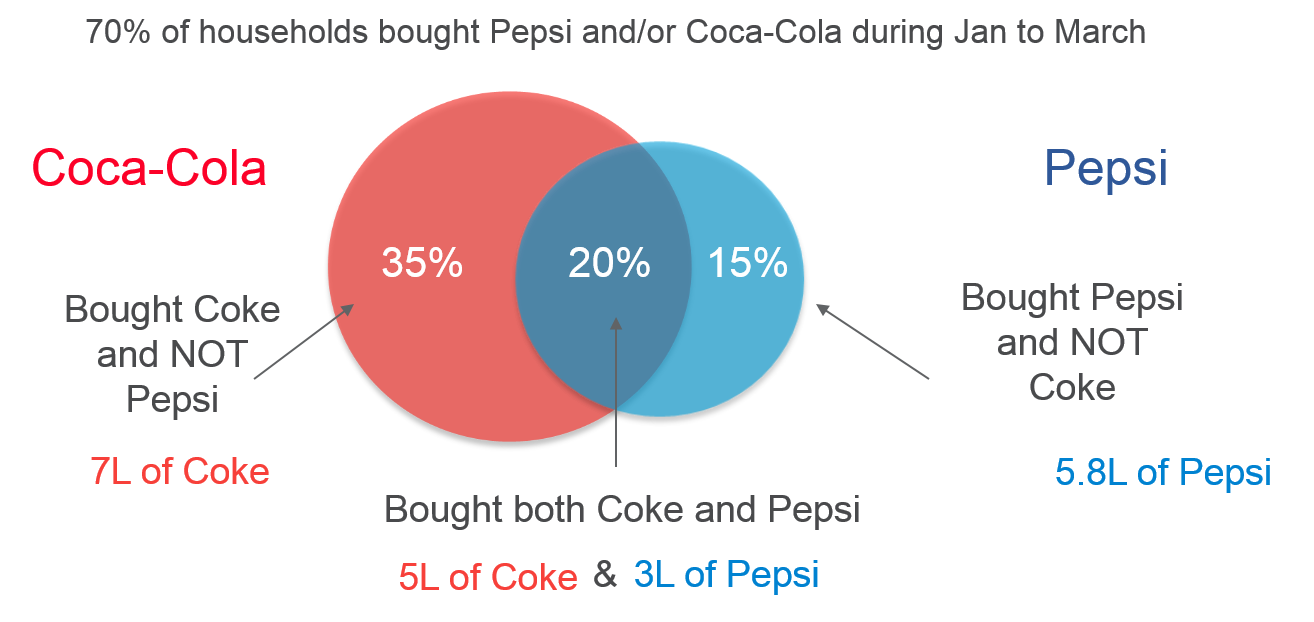
Exhibit 7.14 Overlap analysis of Coca-Cola and Pepsi (fictitious example).
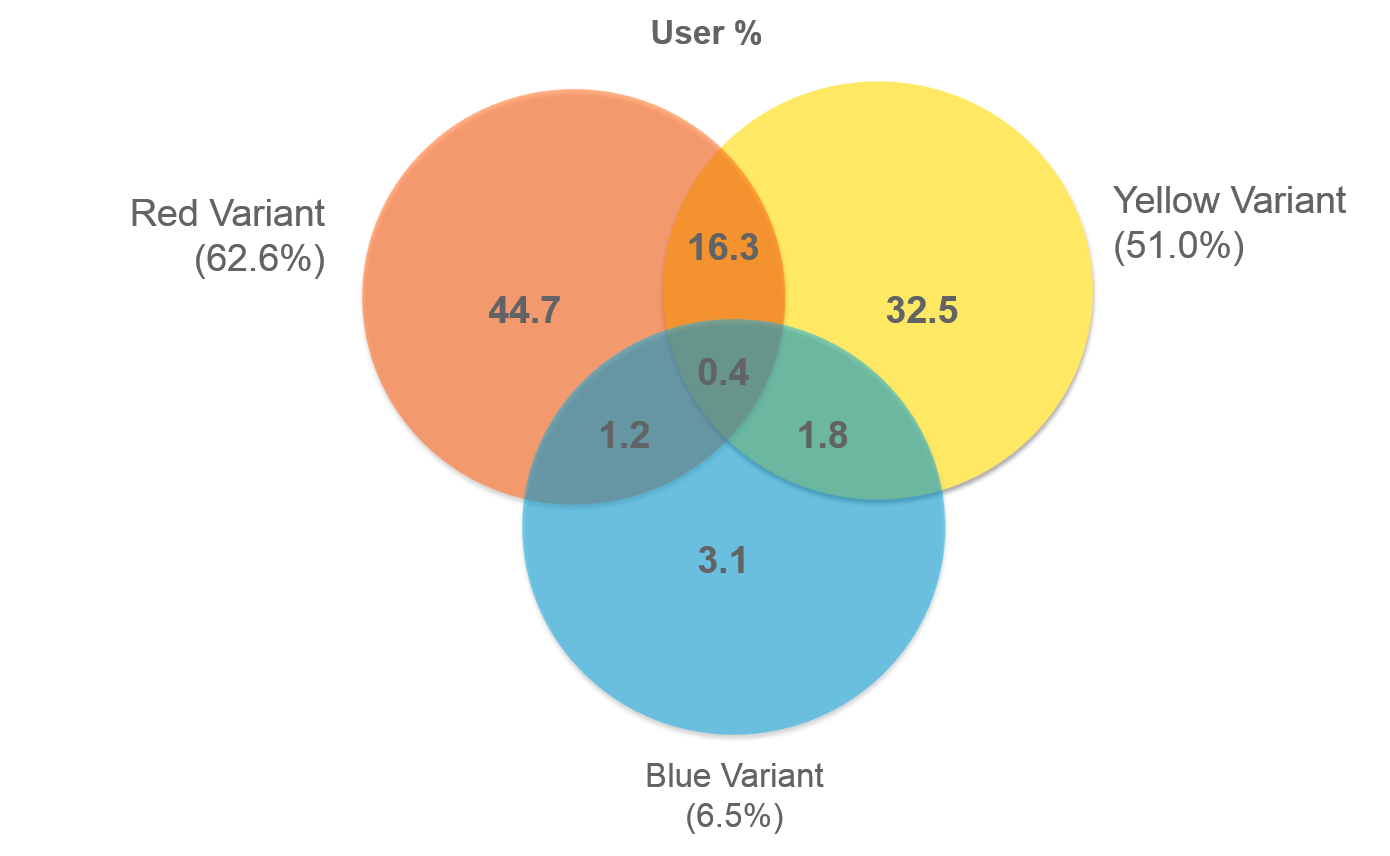
Exhibit 7.15 Overlap analysis
for 3 variants of a brand.
Overlap analysis provides a measure of the level of duplication
in the purchase of a group of products. The
results of the analysis may be presented in Venn diagrams, such as the ones
shown in Exhibits 7.14 and 7.15.
The analysis essentially creates a number of buyer
groups, three in the case of the two-brand analysis in Exhibit 7.14 — ‘Only
Coca-Cola’, ‘Coca-Cola and Pepsi’ and ‘Only Pepsi’. Drilling into these buyer
groups helps marketers address related issues.
Overlap analysis may be used for several varied purposes. For instance, in the
Vizag case study, the overlap between
different forms of detergents provides insights into laundry wash habits. And in the
Johnson’s case example at
the end of this chapter, the analysis illustrates that the Johnson’s brand equity transcends
categories.
Overlap analysis may also be used to analyse a brand’s portfolio.
For instance, a brand manager might be interested in rationalizing the brand’s range.
in reducing the number of variants or pack sizes within the brand’s range.
Besides reviewing other metrics, the brand manager should check whether there
are brand buyers who exclusively buy (i.e., solus buyers) that variant.
In the example in Exhibit 7.15, if variant blue is withdrawn from the market,
the buyers that exclusively bought that variant (3.1% of the brand’s buyer) are
the ones that the brand is most likely to lose.
To take an informed decision the brand manager might
want to check what competitor brands fall within the repertoire of these
buyers. She can do this by analysing their basket of purchases.