
-
Consumer Panels & Consumer Analytics
Consumer Panels & Consumer Analytics
Research Methodology
Width and Depth of Purchase
Buyer Groups
Profile Analysis
Brand Loyalty (Behavioural)
Trial and Repeat
Purchase Frequency
Repeat Decay Curve
Overlap
Basket
Gain-loss
Example — Johnson’s Body Care
- Segmentation
- Qualitative Research
- Quantitative Research
- Customer Satisfaction and Customer Value
- Consumer Panels and Consumer Analytics
- Big Data and Consumer Analytics
- Marketing Education
- Is Marketing Education Fluffy and Weak?
- How to Choose the Right Marketing Simulator
- Self-Learners: Experiential Learning to Adapt to the New Age of Marketing
- Negotiation Skills Training for Retailers, Marketers, Trade Marketers and Category Managers
- Simulators becoming essential Training Platforms
- What they SHOULD TEACH at Business Schools
- Experiential Learning through Marketing Simulators
-
MarketingMind
Consumer Panels & Consumer Analytics
Consumer Panels & Consumer Analytics
Research Methodology
Width and Depth of Purchase
Buyer Groups
Profile Analysis
Brand Loyalty (Behavioural)
Trial and Repeat
Purchase Frequency
Repeat Decay Curve
Overlap
Basket
Gain-loss
Example — Johnson’s Body Care
- Segmentation
- Qualitative Research
- Quantitative Research
- Customer Satisfaction and Customer Value
- Consumer Panels and Consumer Analytics
- Big Data and Consumer Analytics
- Marketing Education
- Is Marketing Education Fluffy and Weak?
- How to Choose the Right Marketing Simulator
- Self-Learners: Experiential Learning to Adapt to the New Age of Marketing
- Negotiation Skills Training for Retailers, Marketers, Trade Marketers and Category Managers
- Simulators becoming essential Training Platforms
- What they SHOULD TEACH at Business Schools
- Experiential Learning through Marketing Simulators
Consumer Panels — Width and Depth of Purchase
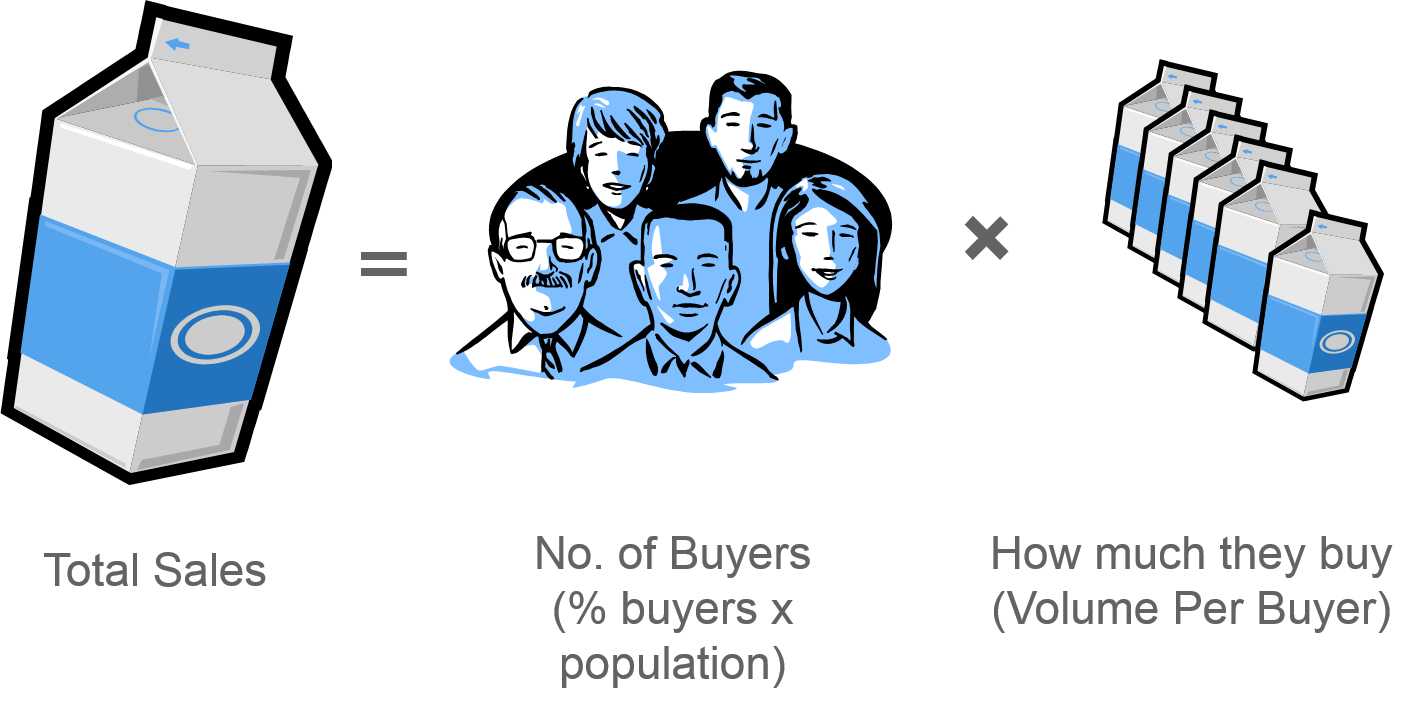
Width and depth of purchase are the two basic components of sales. Width represents the buyer base and is measured in terms of the percentage of households or individuals that purchase the product in a given time period. Depth represents the amount they purchase and is measured in terms of volume or value per buyer.
$$ \%Buyers \,(also\,referred\,to\,as\,Penetration)$$ $$ \qquad=\%\,of\,Households\,(or\,individuals)\, that\,Buy $$ $$ Volume\,per\,Buyer = Volume\,bought\,per\,buying\,household $$ $$ Value\,per\,Buyer = Value\,bought\,per\,buying\,household $$Volume, for FMCG products, is usually measured in kg or L (litre). Many products, however, are available in a variety of forms where direct volume comparisons are not valid. For example, tea is available in forms such as leaf tea, dust tea, tea bag and 3-in-1 tea. The appropriate measure would be to translate the volume of each of these forms into an equivalent representing “number of cups”. Cups are also the preferred measure for other hot beverages like coffee and malt drinks. For detergents, conversion factors are applied to convert concentrated detergent volume and regular detergent volume, to an equivalent measure referred to as “number of washes”.
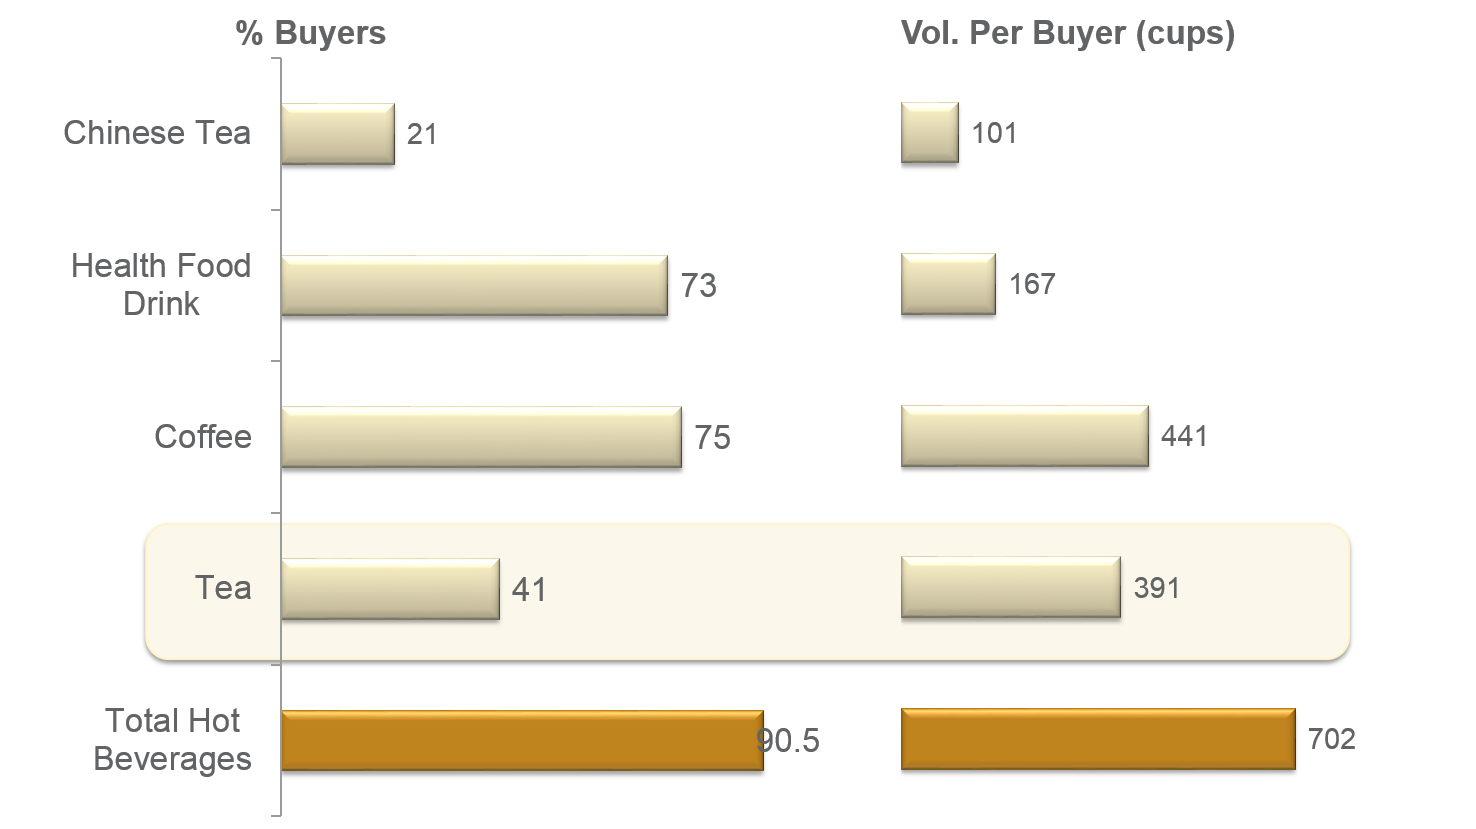
Exhibit 7.5 Width and depth of purchases for different categories of hot beverages, measured over a specific 3-month period.
%Buyers and volume per buyer provide a break-up of the components of sales. As illustrated in Exhibit 7.4, Sales can be derived by multiplying the number of Buyers (%buyers × population) with the volume per buyer (depth of purchase). A comparison of these measures across categories, brands or items reveals how the basic buying behaviour varies from one product to another. In Exhibit 7.5 for instance, compared to coffee and health food drink (HFD, i.e., malt drink), the market for tea is constrained by its relatively small base of buyers. Tea outperforms HFD in terms of volume per buyer, but % buyers is only 41% for the year as compared to 73% for HFD.
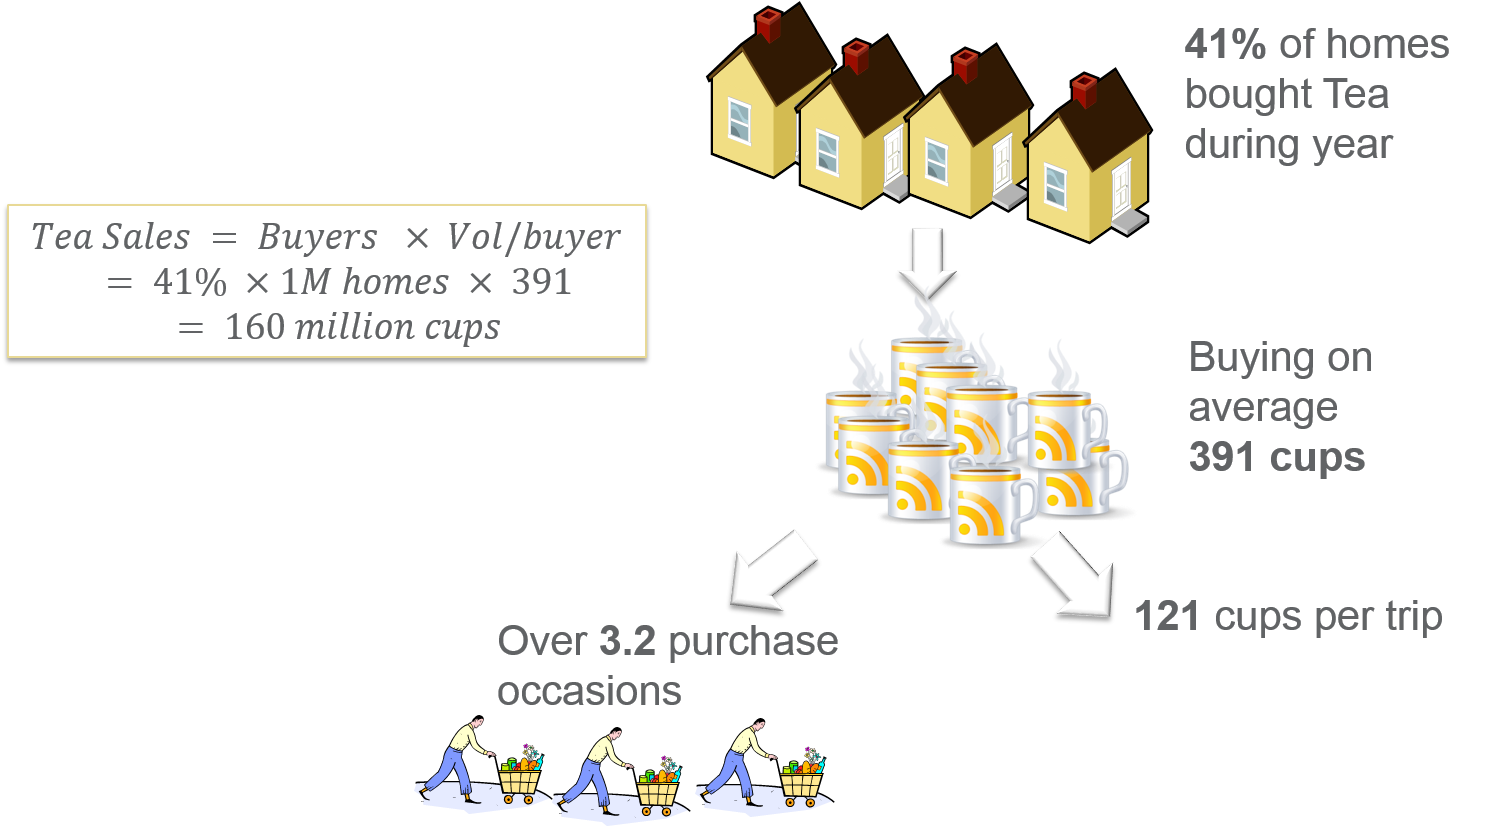
Volume per buyer can be broken down further into number of purchase trips and volume per trip as depicted in Exhibit 7.6. A review of % buyers, volume per buyer, purchase trips and volume per trip trends over time reveals whether width or depth of purchases is contributing to the growth or decline of a brand.
Time Period of Analysis
Measures of buying behaviour such as volume per buyer and %buyers are affected by the length of time period. The percentage of homes that buy a brand (%buyers) over a period of one month will usually be significantly smaller than the percentage of homes that buy the brand over a 3-month time period. The same is true for the quantity they purchase, i.e., volume per buyer.
The ideal length of period for measurement depends on factors such as the inter-purchase interval (IPI), the type of analysis and the size of panel. The IPI for a product category is the average length of time between purchase trips for that product category. This varies very significantly from one product to another in FMCG. For instance, the IPI for chilled milk is roughly one week whereas for shampoo it is about 3 to 4 months. IPI also varies from country to country. In developing countries where pack sizes are small (shampoos, for instance, are sold in sachets in some countries), the IPI is shorter. Typically for analysis of width and depth of purchase, brand loyalty, profile analysis, basket, etc., the length of the time period should preferably be equal to or greater than the IPI.
The IPI is computed by dividing the total category volume per buyer over a relatively large time frame (one or two years) by the average category volume bought per trip over the same time frame.
The size of the panel has a bearing on period of analysis, particularly if the panel is small. For measures such as volume per buyer, we preferably require a sample of 50 or more to arrive at a fairly reliable estimate. We may not be able to achieve this sample size for a relatively small brand, if the time frame is too short. For example, if the %buyers for a brand is 1% for a month, 2.2% for a quarter and 3% for half a year, and if the continuous panel size is 2,000, then we should preferably set the time frame for the analysis at 6 months so that the resulting sample of buyers (60) exceeds the minimum sample requirement of 50.
Previous Next
Use the Search Bar to find content on MarketingMind.
Usage Analysis Demo - %Buyers

Demo of %Buyers analysis on the Destiny analytics platform.
Consumption/Loyalty Analysis Demo
Demo of Consumption (purchase vol/value per buyer) and Loyalty analysis on the Destiny analytics platform.


Contact | Privacy Statement | Disclaimer: Opinions and views expressed on www.ashokcharan.com are the author’s personal views, and do not represent the official views of the National University of Singapore (NUS) or the NUS Business School | © Copyright 2013-2026 www.ashokcharan.com. All Rights Reserved.